Unlock a world of possibilities! Login now and discover the exclusive benefits awaiting you.
- Qlik Community
- :
- All Forums
- :
- QlikView App Dev
- :
- Re: Moving average trend calculation.
- Subscribe to RSS Feed
- Mark Topic as New
- Mark Topic as Read
- Float this Topic for Current User
- Bookmark
- Subscribe
- Mute
- Printer Friendly Page
- Mark as New
- Bookmark
- Subscribe
- Mute
- Subscribe to RSS Feed
- Permalink
- Report Inappropriate Content
Moving average trend calculation.
Hi all...I need to show a trend of current month sales vs previous 3 month moving average sales excluding the current month for a selected year in line chart irrespective of user selection. For example, if current month sales for the month of July in the year 2014 is 2000, average sales of previous 3 months(April,May,June) is to be shown against July and likewise for all the months.
Can anybody please help??
- Tags:
- expression
Accepted Solutions
- Mark as New
- Bookmark
- Subscribe
- Mute
- Subscribe to RSS Feed
- Permalink
- Report Inappropriate Content
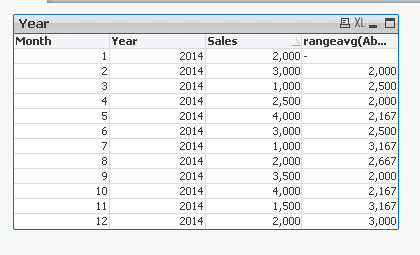
If that the case and 3 last month are taken into account so month 3 should be 2500 not 1667,
Please see below

The Expression is
RangeAvg(Above(sum(Sales),1,3))
- Mark as New
- Bookmark
- Subscribe
- Mute
- Subscribe to RSS Feed
- Permalink
- Report Inappropriate Content
Could you post sample of your data?
- Mark as New
- Bookmark
- Subscribe
- Mute
- Subscribe to RSS Feed
- Permalink
- Report Inappropriate Content
This is the sample data. Please note that the month for which the avg sales is being calculated, is excluded and only its previous 3 month sales is taken into consideration.
Year | Month | Sales | Previous 3 month Avg Sales |
| 2014 | 1 | 2000 | 0 |
| 2014 | 2 | 3000 | 2000 |
| 2014 | 3 | 1000 | 1667 |
| 2014 | 4 | 2500 | 2000 |
| 2014 | 5 | 4000 | 2167 |
| 2014 | 6 | 3000 | 2500 |
| 2014 | 7 | 1000 | 3167 |
| 2014 | 8 | 2000 | 2667 |
| 2014 | 9 | 3500 | 2000 |
| 2014 | 10 | 4000 | 2167 |
| 2014 | 11 | 1500 | 3167 |
| 2014 | 12 | 2000 | 3000 |
- Mark as New
- Bookmark
- Subscribe
- Mute
- Subscribe to RSS Feed
- Permalink
- Report Inappropriate Content
If that the case and 3 last month are taken into account so month 3 should be 2500 not 1667,
Please see below

The Expression is
RangeAvg(Above(sum(Sales),1,3))
- Mark as New
- Bookmark
- Subscribe
- Mute
- Subscribe to RSS Feed
- Permalink
- Report Inappropriate Content
Excellent and Useful blog created by Gysbert...
Calculating rolling n-period totals, averages or other aggregations
- Mark as New
- Bookmark
- Subscribe
- Mute
- Subscribe to RSS Feed
- Permalink
- Report Inappropriate Content
Thanks Robert, It's working absolutely fine.
- Mark as New
- Bookmark
- Subscribe
- Mute
- Subscribe to RSS Feed
- Permalink
- Report Inappropriate Content
Thanks Manish, that was helpful.
- Mark as New
- Bookmark
- Subscribe
- Mute
- Subscribe to RSS Feed
- Permalink
- Report Inappropriate Content
You are welcome.