Unlock a world of possibilities! Login now and discover the exclusive benefits awaiting you.
- Qlik Community
- :
- All Forums
- :
- QlikView App Dev
- :
- Re: Pivottables, dimensions, formulae, graphs
- Subscribe to RSS Feed
- Mark Topic as New
- Mark Topic as Read
- Float this Topic for Current User
- Bookmark
- Subscribe
- Mute
- Printer Friendly Page
- Mark as New
- Bookmark
- Subscribe
- Mute
- Subscribe to RSS Feed
- Permalink
- Report Inappropriate Content
Pivottables, dimensions, formulae, graphs
Hi All,
I have data which I calculated in the following table, each row is a formula sum(Claims)/sum(GEP).
| Period | Loss Ratio |
| Month 1 | 54.5 |
| Month 2 | 55.7 |
| Month 3 | 57.8 |
| Month 4 | 57.9 |
| Month 5 | 59.8 |
| Month 6 | 58.7 |
| Month 7 | 60.7 |
I would like to have calculated using the dimension Underwriting Year:
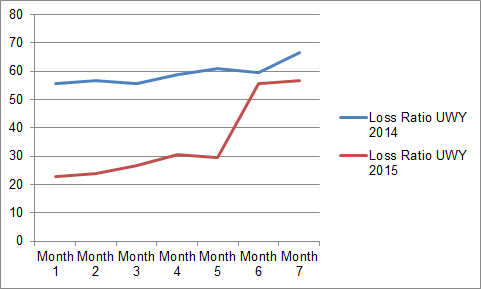
| Period | Loss Ratio UWY 2014 | Loss Ratio UWY 2015 |
| Month 1 | 55.5 | 22.8 |
| Month 2 | 56.7 | 23.7 |
| Month 3 | 55.8 | 26.7 |
| Month 4 | 58.9 | 30.5 |
| Month 5 | 60.8 | 29.6 |
| Month 6 | 59.7 | 55.5 |
| Month 7 | 66.7 | 56.7 |
However, when I add the dimension, I calculates not the individual loss ratios per UWY. If I created a table for each UWY, I would use the formula sum({<UWY='2014'>}Claims)/sum({<UWY='2014'>}GEP).
But I would like to be able to creat a graph like this:

How would I do that? As I am not an English speaker, I am unsure what to look for in the forum.
Many thanks for your help and sorry, if this question has already been asked.
Best regards,
Jan
- Mark as New
- Bookmark
- Subscribe
- Mute
- Subscribe to RSS Feed
- Permalink
- Report Inappropriate Content
May be create like below
Dimension - Period
Label - ='Loss Ratio UWY' & Max(Year)-1
Expression 1 - sum({<UWY={'2014'}>}Claims)/sum({<UWY={'2014'}>}GEP)
Or This is for Dynamic
sum({<UWY={'$(=Max(Year)-1)'}>}Claims)/sum({<UWY={'$(=Max(Year)-1)'}>}GEP)
Label - ='Loss Ratio UWY' & Max(Year)
Expression 2 - sum({<UWY={'2014'}>}Claims)/sum({<UWY={'2014'}>}GEP)
Or This is for Dynamic
sum({<UWY={'$(=Max(Year))'}>}Claims)/sum({<UWY={'$(=Max(Year))'}>}GEP)
- Mark as New
- Bookmark
- Subscribe
- Mute
- Subscribe to RSS Feed
- Permalink
- Report Inappropriate Content
If Year is a dimension, you can simply create a pivot chart with Year as column. And after trasform your pivot in graph.