Unlock a world of possibilities! Login now and discover the exclusive benefits awaiting you.

Analytics & AI
Forums for Qlik Analytic solutions. Ask questions, join discussions, find solutions, and access documentation and resources.
Data Integration & Quality
Forums for Qlik Data Integration solutions. Ask questions, join discussions, find solutions, and access documentation and resources
Explore Qlik Gallery
Qlik Gallery is meant to encourage Qlikkies everywhere to share their progress – from a first Qlik app – to a favorite Qlik app – and everything in-between.
Qlik Community
Get started on Qlik Community, find How-To documents, and join general non-product related discussions.
Qlik Resources
Direct links to other resources within the Qlik ecosystem. We suggest you bookmark this page.
Qlik Academic Program
Qlik gives qualified university students, educators, and researchers free Qlik software and resources to prepare students for the data-driven workplace.
Recent Blog Posts
-
Meet Jerry Roek- A Qlik Professor Ambassador for 2021!
This week we are excited to feature Professor Jerry Roek, who we welcomed into the 2021 class of Professor Ambassadors! Jerry first joined the Qlik A... Show MoreThis week we are excited to feature Professor Jerry Roek, who we welcomed into the 2021 class of Professor Ambassadors! Jerry first joined the Qlik Academic Program back in 2017 and has been a loyal member ever since.
During Jerry’s first year in the program, he was teaching a Management Information Systems (MIS) course for undergraduate students covering variety of major degrees in the school of business. He was inspired to join the Qlik Sense Academic Program to demonstrate the importance of business analytics, how it correlates to technology and most importantly the impact in which business analytics will have in the future career paths.
During the MIS course, Jerry invited his students to join the Academic Program which granted them to access to a variety of valuable resources. Jerry incorporated the Qlik Sense training and to ensure the students were making the most of their time, he embedded the Qualification exam so many of the students were able to receive a Qlik Sense Business Analyst certificate at the end of the semester. Jerry credits these resources and specifically the qualification to the popularity of the course.
Not only does Jerry utilize the resources provided by the Academic Program but he has also gone a step ahead and built his own project application that he uses in class, one of which was featured in the Qlik Gallery. The application provides students a structured approached to learn a variety of visualizations, statistical formulas, associative selection and dynamic variable inputs for forecasting – all key concepts in the study of business analytics. The application is applicable in both management information systems and statistics/business analytics courses.
When asking Jerry the importance of analytics, he explains "As we have come to learn over the course of the past year, the study of data literacy and business analytics is important to any industry – business, healthcare, manufacturing, retail, etc... Throughout a student's education journey, it is critical they receive a variety of exposure to these concepts along with how it is incorporated in technology. Former students have reached out to me after graduation indicating that they now see importance of business analytics, technology and statistics and how it is implemented in making critical business decisions!"
Jerry's encouragement has also resulted in other faculty members to embed these concepts into their curriculums!
As an adjunct faculty member, Jerry has introduced the Qlik Sense academic program and concepts of data literacy in curriculum at Oakland University School of Business and Texas A&M – San Antonio College of Business.
We look forward to working with Jerry this year and supporting his efforts to enable more students on business analytics.

-
Data Alerting - on the next Do More with Qlik
Join me next Thursday to see our latest Qlik Sense SaaS feature - data alerting. Data alerting provides data-driven alerts that help you monitor your ... Show MoreJoin me next Thursday to see our latest Qlik Sense SaaS feature - data alerting.
Data alerting provides data-driven alerts that help you monitor your business and take action when there are sudden changes or outliers in your data. Alerting capabilities include evaluation of new data against thresholds, comparisons between measures and conditions, and the ability to trigger alerts based on individual dimension values. Alerting is included within the Qlik Sense Enterprise SaaS user interface, allowing both self-service and managed alerts.
Sign up today: https://go.qlik.com/Do_More_with_Qlik_Webinar_Series-Nov19_Registration-LP.html to see this awesome feature live - and take this opportunity to interact and ask questions. Hope to see you there!
MAKE SOME NOISE!!!! WHOOP WHOOP! - Check out the hype video below.

-
Catalog capabilities are now available in SaaS editions of Qlik Sense
Click here to see video transcript. Instead of simply replicating current Qlik Catalog functionality in SaaS, we took the approach of determining wh... Show MoreClick here to see video transcript.
Instead of simply replicating current Qlik Catalog functionality in SaaS, we took the approach of determining which catalog capabilities should become an integral part of the Qlik Sense SaaS experience based on what would provide the biggest impact to optimizing the analytic experience. With this first release of data cataloging capabilities in SaaS, users will now see that data sets have become elevated to now be an integral part of the cloud hub experience.
The initial set of catalog capabilities enables users to assign tags and alternative business names to any file-based dataset, making it easy for anyone to find and determine which data is best for them to use. Users can also profile datasets and fields as well as view sample data. This enables users to decide whether a dataset is appropriate for them before adding it to an app. You can learn more about these new capabilities in this video:
Click here to see video transcript.
The existing Qlik Catalog product, already being used by both Analytic and Data Integration customers, will continue to be supported and maintained by Qlik. This new catalog capability, as well as many future catalog enhancements, will be delivered as part of the base Qlik Sense SaaS license. Additional Qlik Catalog capabilities will be introduced as part of SaaS-based Data Integration offerings in the future.It’s been great to see more and more Qlik Sense customers learn and adopt the use of Qlik Catalog since our acquisition of Podium Data in 2018 - and this release will further expand the use of cataloging among our analytics customers.
Be sure to check out today's Do More with Qlik session as well - where we will be covering missed features and overlooked capabilities: Register Here
Visit our SaaS change log on help.qlik.com to see other recent additions to our offering!
Can't see the videos? YouTube blocked by your organization or region? Download the .mp4 files attached to this post to view on your computer or mobile device.
-
Security Rules and Performance in Qlik Sense
Security rules are a very powerful tool intended to assist Qlik Sense administrators in managing access to Qlik Sense features. Using these rules admi... Show MoreSecurity rules are a very powerful tool intended to assist Qlik Sense administrators in managing access to Qlik Sense features. Using these rules administrators can manage not just the ability to access or create applications, but almost all features of the product including data connections, streams and even individual components of the Qlik Management Console.
This allows administrators to define user and administration roles that closely match unique organization needs rather than merely rely on an out of the box user model. Unfortunately, this comes at a cost, when a user logs in and access the system all the relevant security rules need to be evaluated to determine the correct access rights for the current screen. This can potentially lead to long load times and poor performance in especially in large systems.
This blog post will cover a summary of the default user model Qlik Sense ships with, along with a closer examination of how security rules are evaluated and cached and in doing so will provide a framework for administrators to ensure that they can get the most out of their system and where possible reduce unintentional performance impacts on users.
The Default Security Rules
Qlik Sense ships with a set of default security rules that provide a set of administration roles and user roles for organisations to use and modify to meet their own needs.
When you first log in to a fresh installation of Qlik Sense September 2019, you will be greeted with a set of 63 rules which all work together to create that initial user model.
Broadly speaking the model works as follows (Items in bold are unchangeable rules and are always true):
In the Hub:
- Users can create apps
- Owners of items can see those items
- If you can read a stream, you can read all apps published to the stream
- If you can read an app, you can read the content of that app
- If you can update an app, you can update the contents of that app
- If you can read an unpublished app, you can create objects that are part of that app
- If you can read a published app, you can create some objects on that app
- Everyone has access to the Everyone Stream
- Administrators have access to the Monitoring Apps stream
In the QMC:
- The Service Account has access to everything
- The Root Administrator has access to everything
- Audit Administrators have access to audit sections and entities
- Content Administrators have access to content section, entities and connection related security rules
- Deployment Administrators have access to deployment sections and entities, apps (to manage load balancing) and license rules
- Security Administrators have access to security sections and entities
As you can see there are two separate contexts for rules and that, for the most part administrator roles only impact the Qlik Management Console. This is because all administration activity is expected to happen in the QMC and not the hub. It is possible, and in some cases desirable, for your root administrator to operate entirely without an assigned license, though this does prevent them from using the monitoring applications.
One final note about Security rules in Qlik Sense. Rules can only ever add privileges, they can never take them away. This is very important when trying to design your access model, try to think in terms of what users can do, rather than in terms of what they cannot do and the structure of your rules will flow much more easily.
Security Rule Evaluation
Let’s go a little deeper and focus on how the system evaluates security rules.
Every rule has a set of attributes that are used during evaluations:
- Context (Does this rule apply in the QMC, the Hub or both)
- Resource Filter (The parts of the system the rule covers)
- Actions (The privileges the rule grants)
- Conditions (The set of conditions that ultimately determine who is granted the actions)
- A Score (A dynamically generated metric indicating how useful the rule is, the more
When a user accesses Qlik Sense, the system pulls only rules relevant to the current context and resources (for example, when accessing the hub, we need to evaluate the rules for a user’s apps, as well as the rules for streams).
The system also will retrieve the relevant resources (in this case all published applications, applications the user owns, and all streams) to evaluate the combination of rules, user and resources.
It runs through these rules in score order, these scores are stored in the Security Rule Evaluation Cache, which means the values are lost every time the system restarts.
Once it has finished evaluating the rules, the results are stored in the Security Rule Evaluation Cache so that the next time this user accesses the same page the system can simply retrieve the result of the calculation from the cache and if necessary only evaluate the rules on new apps.
The system will exit the evaluation early if the user has already been granted all the requested rights to a resource. For example: the Root Administrator will generally find most of the QMC will load very quickly because the rule evaluation is very simple. One of the oldest rules in any given system grants them all privileges on everything in the QMC, that rule will generally score very highly and so be evaluated very early and then there is no need to perform any further checking as rules can only add and not take away.
On the other hand, a limited user who has been granted access to only the Apps Section of the QMC and a small handful of applications may find that interface takes a very long time to load as the system will first need to evaluate enough rules to give access to the requested resource (i.e. in a system that has no previous evaluation, the less access the user has the longer the evaluation will take.
Finally, security rule evaluation takes place on a mixture of different nodes, some evaluations will take place on the node with the proxy you are connecting to, some will take place on the node with the engine, and some will take place on the central node.
In the case of QMC activity, all evaluations will take place on the central node, and in the case of very limited users, those evaluations will be relatively lengthy and complex. On larger systems this can lead to a rather slow user experience on the QMC. In extreme cases this can lead to the system becoming effectively unavailable on all nodes. In Qlik Sense September 2019 we have implemented 2 feature flags to increase the scalability of the QMC at the cost of reduced functionality.
See How to enable QMC Limits in Qlik Sense (KB 000086580) for details.
The Security Rule Evaluation Cache
In the previous section I mentioned the Security Rule Evaluation Cache Cache, which stores the results of security rule evaluations in order to speed up future access. Why then does your system seem to slow down as more users and apps are added? After all the cache should eventually cover all common system activities.
The cache is deliberately designed to be short lived, there are many circumstances under which it is either partially or wholly invalidated or discarded, meaning that a full rules evaluation needs to be completed once more. This is broadly because we need to know that the cache is correct, anytime something changes (or could have changed) we cannot rely on the cache and must revert to the slower approach.
There are basically 3 types of cache invalidation:
- Complete invalidation (The entire cache is discarded)
- User based invalidation
- Entity based invalidation
1. Complete Invalidation
- Any change to security rules, load balancing or license rules
- Any change to custom properties values (i.e. the potential possible values a custom property can be assigned)
- When the system is restarted (the cache is never written to disk, and rules may have changed since the service last started)
- If the connection to the database is disrupted
As these changes could have a wide ranging impact, the entire cache is discarded and must be rebuilt by user behavior.
When this cache is invalidated, the scores for every rule are also reset to 0, meaning that we also lose any optimizations gained since the session started.
2. User based invalidation
- Any change to a user attribute (e.g. the user is added or removed from a group)
- A user’s custom properties are changed
Rules are often based on user attributes, changes to that user mean we cannot ensure the cached results still apply, so we discard the cached results linked to that user.
3. Entity based invalidation
- Almost any change to a single entity. (e.g. changing an app’s name or owner, approving a community sheet, renaming a data connection)
Much like with users, changing any aspect an entity or resource that can be addressed in a rule means that we cannot ensure the cached results still apply for that entity, so we discard the cached results linked to it.
In Qlik Sense February 2019, additional logging was implemented to record when a cache invalidation occurs along with its type (Complete, User, Entity)
Recommendations/Best Practices:
If you want to provide the best performance for your users try to make rule changes near scheduled downtime, when the cache is already going to be invalidated due to a service restart.
To reduce the number of evaluations that need to take place, try to ensure you have a regular clean up process where you export and delete old apps that are no longer in use.
Limited users in the QMC should also have a very limited scope, i.e. only get access to one or two sections. Where possible try to centralise QMC activities to a smaller number of administrators rather than expand access to the entire user base. In a large organization it is better to have a small number of administrators and a ticket system than to grant every developer access to the QMC for small scale task management.
-
New Innovations and new delivery for a new year! Join us Live!
Don’t miss the first Qlik Insider of the year where you’ll learn about the latest augmented analytics and visualization improvements, and also our ... Show MoreDon’t miss the first Qlik Insider of the year where you’ll learn about the latest augmented analytics and visualization improvements, and also our new consolidated SAP connector and new data catalog capabilities in Qlik Sense SaaS. This is your chance to ask those burning questions Live! Register today and become a Qlik Insider and stay informed all year long as we roll out more groundbreaking product innovations, enabling new ways to make faster and easier data driven decisions.
Can't see the video? YouTube restricted by your organization or region? Download the .mp4 attached to this post to view on your computer or mobile device
Also be sure to Visit our new dynamic Product Innovation page at qlik.com/roadmap to learn more about Qlik’s 2021 product strategy and vision.
-
Gartner Analysis 2021 (and BARC versus)
This is an application to demonstrate the Gartner quadrant. Very cool for anyone who wants to learn how to make one (quadrant).In the application ther... Show MoreThis is an application to demonstrate the Gartner quadrant. Very cool for anyone who wants to learn how to make one (quadrant).
In the application there is an option with a background image and another one building the entire quadrant using the coordinates of the map object.
App demo with video: https://www.linkedin.com/posts/tensini_qlik-activity-6770513314645581824-jYX1
-
Forum Consolidation - Phase 1
[Update February 2, 2021: Forum Consolidation to begin Feb 5 and may last 2-3 days. During this time system mail and notifications will be disabled] ... Show More[Update February 2, 2021: Forum Consolidation to begin Feb 5 and may last 2-3 days. During this time system mail and notifications will be disabled]
-----------------------
Hello Members,
Our Community Moderators move content from one forum to another in part because questions get posted to the wrong forum. When that happens it may take longer for that question to get answered.
I can't exactly recall how it came to be that we have 13 QlikView forums (yikes!) but it's no surprise we have this issue.
Well, this is about to change and we hope to make your life MUCH easier when it comes to asking questions in our community!
Phase 1 of our forum consolidation project will focus on QlikView. Phase 2 will focus on a consolidation of Qlik Sense forums. There may be a Phase 3 but let's save that conversation for another day. This article will walk you thru the changes you can soon expect:
- Today, we have 13 QlikView forums. We are collapsing that to 5.
- 8 QlikView forums are being retired. Content in retired forums will be relocated.
- Of the 5 forums remaining, 4 are being renamed.
Here is a snapshot on what you can expect.
4 out of 5 forums will be renamed:
Content housed in retired forums will be moved. Here is your guide:
*all content moved has been tagged with the old forum name. Check tag cloud :
This project involves many moving parts: movement of thousands of articles, renaming and downsizing of forums. Plus, change is never easy and sometimes can feel disruptive. We recognize this is a very big change for our members. At the end of the day we strive to simplify the question-asking process so that in return members receive answers quickly. We know you have other things to do.We'd like to thank the Qlik Product Marketing Team, Qlik Digital Support Team and the few randomly selected community members that provided guidance and input. We anticipate the change to go live by end of next week. If anything changes, you will be the first to know.
See you online!
@Sue_Macaluso and Melissa

-
Featured Content Friday – Landscape Chart with Birds and Flowers
Hello Qlik Users!I’m always amazed at what our users create using Qlik products. Today’s Featured Content Friday is no exception. He’s a long-time use... Show MoreHello Qlik Users!
I’m always amazed at what our users create using Qlik products. Today’s Featured Content Friday is no exception. He’s a long-time user (about 20 years) and holds the Owner, CEO, and Consultant titles for his own company.
Robert of Svebeck Consulting AB!
Robert says his favorite thing about Qlik is:
The app Robert created is so unique. It shares a visual story.
I’ll let Robert tell you in his own words about his creation:
“The story behind this chart started with me talking to Shirajul Kabir Rab who I collaborate with a lot on Data On The Rocks and Data On The Earth.
We were talking about trying to find new ways to visualize data, when the idea of visualizing data in a simple landscape came to us.
Since I have been investigating a lot on the Map Object I realised that it is possible to make a Mock-Up chart using the map object to try the idea out.
In parallel to this I also had an idea to make a chart that would be a new kind of network chart, or like a combination of the Scatter chart and a Sankey chart, basically trying to find a way to visualize how one “dot” in the scatter is connected to another “dot” in the scatter. The more ways a dot is connected to another dot, the more lines connects them. I realised that it was possible to make this chart, again as a Mock-Up, using the map chart.
Since the result of this new kind of chart made the object look like birds, I decided to combine this new chart (that I named Seagull Chart) with the idea of a Landscape chart, and this is the result.
In this example, the code is not really re-usable in a simple way for a business application – and should be seen rather as inspiration for new ways of displaying data.
I decided to see the birds as existing customers where the 3 dots that shape the bird represents 3 months of sales. The number of lines between the dots represents how diverse the customer is buying in a scale from 1-3, meaning 3 lines = they buy all kinds of material and 1=they buy as limited amount of material.
The idea of the birds flying in the sky, just like in a scatter chart their position (where they fly) are also carrying a purpose, the closer to the sun, or the higher up, the better “Customers”.
To add more features to the landscape I added a flower object in the bottom which would represent prospects.
The Landscape concept can be applied also to other kind of data (not just Sales), such as this: flowers are new projects, birds are “employees”, and active projects are perhaps trees in the landscape, and employees who are working on a project are “circulating” around that tree. It can become anything, the concept is really interesting. Was also thinking about other kinds of landscapes, with rivers and mountains. It can visualise many cool things.
The script is very simple, and I am just generating random data to fit the different layers in the map-object.
Not sure how much is needed to explain the map object, as this is pretty self explained for those who know how the map object works.
And the point of this app is not to explain How this is done, rather inspire chart developers to do something new.”
You can find Robert’s original post on LinkedIn:
*The information in this post is provided as-is and to be used at your own discretion. Depending on the tool(s) used, customization(s), and/or other factors ongoing support may not be provided by Qlik Support.
Robert also supplied the app and images. You can find the attachments below. Take a look and play around. Hopefully, it will inspire you as well!
Thank you @RSvebeck for sharing your landscape chart with us!
Do you want to be spotlighted in a future post? See our Featured Content Friday Revamp for more information on submitting your dashboards, screenshots, ideas, videos, workarounds, how-to’s, and for your chance to win some Qlik swag!
Thank you for being a part of the Qlik Community and choosing Qlik!
Kind regards,
Qlik Digital Support
-
Escape sequences
When writing a string in QlikView, it must usually be enclosed in single quotes. But what if you want to use a single quote inside the string? The fol... Show MoreWhen writing a string in QlikView, it must usually be enclosed in single quotes. But what if you want to use a single quote inside the string? The following will not work:
Set variable = 'This year's number';
The reason is that the apostrophe in the word year’s will be interpreted as the single quote that ends the string. So what should you do instead?
One solution that I have seen often in the community is to hard-code it using the Chr() function:
Let variable = 'This year' & Chr(39) & 's number' ;
Let variable = Replace( 'This year#s number', '#', Chr(39) ) ;Both these work fine, but they are maybe not very elegant. Instead, I would suggest one of the following methods. First, you can often use a different delimiter:
Set variable = [This year's number];
As you can see, the Set statement can also use square brackets (or double quotes) as delimiters. Hence, if you just use a delimiter that is different from what you have in the string, it will work. The same is true if you need to load from a file with a name that contains single quotes or square brackets. Just make sure you quote it using double quotes (which is a character that shouldn't exist in file names):
Load … From "This year's numbers [3].xlsx"
But there is a second way this problem can be solved. An escape sequence:
Let variable = 'This year''s number';
The Let statement is different from the Set statement in that you must use single quotes as delimiter for literals. So you need to use an escape sequence instead: Just write the single quote twice, and the two characters will not be interpreted as a string delimiter, but instead as a single instance of the character itself. The same method can be used in other places also, e.g. in Set Analysis. The following expression is a correct one picking out the records from Robert's unit:
Sum({1<Unit={'Robert''s unit'}>} Amount)
An escape sequence can be used for double quotes and square brackets, too. So if you have a field name that contains double quotes, for instance Name”5, you can load it either by using square brackets or by escaping the double quote:
[Name"5] as Field1,
"Name""5" as Field2,If the field name contains square brackets, e.g. a field called Name[5], only the right bracket needs to be escaped. Such a field can be loaded in either of the two following ways:
"Name[5]" as Field1,
[Name[5]]] as Field2,With this, I hope you got some ideas about how to deal with odd characters and strangely named fields.
Further reading related to this topic:

-
Bracket Mania – Using Qlik Sense to predict the winners of the NCAA Men’s Basket...
The 2021 NCAA Men’s Basketball Tournament starts today. This college basketball tournament is a phenomenon in the United States as millions of folks r... Show MoreThe 2021 NCAA Men’s Basketball Tournament starts today. This college basketball tournament is a phenomenon in the United States as millions of folks rush to join bracket challenges to show how much they know about college basketball (and to win a little bit of money). I am one of those people.
There are different approaches to completing your bracket, some less scientific than others. I choose to let the data guide me. One person who is considered a guru at predicting match-up winners through data is Ken Pomeroy. He developed a couple of static based expressions that help to calculate both the win probability for each team in a match-up, as well as the total points scored for each team. These metrics are gold when it comes to completing a bracket.
For years, the Demo Team has produced a bracket mash-up where we let users fill out a bracket and we give them an inside look for each match-up using the KenPom calculations. This year, I decided to simply build a Qlik Sense app to allow users to select any two teams and quickly analyze the match-up. Because the first-round games are the only round where we know the match-up, we needed a way to allow users to see any number of combinations of matchups for the future rounds based on who they predicted to advance to the next round.
The First Four round or Play-In games were played last night. The KenPom calculations predicted the following results:
Texas Southern vs Mt St Mary’s
Texas Southern won 60-52. Not a good start for the match-up predictor which predicted St Mary’s to win using the win probability calculation.
Drake vs Wichita State
Drake won the game 53-52, which was predicted in both the predict winner by score and by win probability.
Norfolk State vs Appalachian State
Norfolk State won 56-55 which the win probability predicted.
Michigan State vs UCLA
UCLA won the game 86-80, which was predicted in both the predict winner by score and by win probability.
So after miscalculating the first match-up of the tournament, the predictor came back and correctly predicted the next 3 matchups (75% winning percentage). The goal of most profession gamblers is a correct pick rate of around 60%. I would say we are on the right track.
The First Round starts today, and the match-up predictor has predicting a couple of upsets. For example:
#9 Wisconsin over #8 North Carolina
#10 Rutgers over #7 Clemson
#10 Maryland over #7Connecticut
Time is running out! Brackets close at 12pm EST today, so hurry up and check out the Bracket Mania app to either edit your current predictions or to complete your bracket for the first time. The Bracket Mania app can be found here.
Enjoy the Madness! Good luck on your bracket!!

-
Achieving a Data-informed Mindset
But, even when you base decisions on data, are you sure you are using the right data? Are you sure you are asking the right questions of the data? Are... Show MoreBut, even when you base decisions on data, are you sure you are using the right data? Are you sure you are asking the right questions of the data? Are you sure you are challenging any assumptions you have with the data? Are you sure you have enough context from the data to ensure it is not telling you only part of the story?
To Read More, See Kevin Hanegan's Blog here
To help take your firsts steps on your journey to making data-informed decisions, Qlik is proud to launch the first-ever educational course that covers all these topics in a cohesive fashion: data and analytic strategies, data literacy, and implementing all this using Qlik Sense. This 15-week blended course combines recorded lectures, weekly 60-minute, live instructor-led sessions, hands-on activities, and much more to guide you on your mindset shift.
Interested in learning more? Take a look at the course datasheet. Interested in registering? Visit our registration site to see available classes.

-
Qlik Sense SaaS in 60 - Learn what's new each week in Qlik Sense SaaS - This we...
Hey guys - we started a new series of succinct videos to keep you up to date on what's new in Qlik Sense SaaS on a weekly basis. Subscribe to the ne... Show MoreHey guys - we started a new series of succinct videos to keep you up to date on what's new in Qlik Sense SaaS on a weekly basis. Subscribe to the new YouTube Qlik Sense SaaS in 60 Playlist and stay informed as it happens.
This week we introduce our new Databricks connector and the ability to Binary Load Qlik Sense apps directly from Personal and Shared spaces using their APP ID:
Can't see the video? YouTube blocked by your region or organization? Download the attached .mp4 to watch on your computer or mobile device.
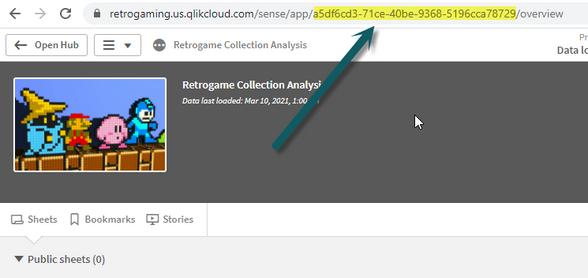
Note:The BINARY statement must be the first statement at the top of the script in the Qlik Sense App. If you have access to the app (personal / shared space) - it will automatically find the app it needs. There isn't a need to specify the specific space location. Simply us the Binary statement and the APP ID.
BINARY [APP ID]
Example: -
BINARY [a5df6cd3-71ce-411be-9368-5236cca78729]
The APP ID can be found in the URL of the browser when accessing the app you want to use for binary loading.Transcript:
Hey guys this is Mike Tarallo with Qlik and welcome to SaaS in 60. This week we have added a new connector for Databricks and the ability to perform binary loading of Qlik Sense apps that reside in Shared and Personal Spaces. To support the growing popularity of Databricks, a Qlik strategic partner, Qlik Sense now includes a pre-configured connector for Databricks, including the new Spark 3.0 engine. Utilizing the Databricks SQL Analytics service, the Databricks connector enables Qlik Sense users to easily include data from Databricks to gain a comprehensive view of their business as well as generate new insights and data-driven actions.
Binary loading is the process of loading a data model directly from a Qlik Sense app instead of a traditional data connector. You can now easily reuse data models from Qlik Sense apps that reside in personal and shared spaces. Note the source and target app must be in the same space. This is in addition to the existing capability to binary load from third party file share such as S3 or Google Drive....and that is your SaaS in 60.
-
Embedded Visualization Lifecycle - From Viz API to nebula.js
Let’s take a look at how the visualization lifecycles (creating/updating/destroying visualizations) in the Visualization API and nebula.js currently c... Show MoreLet’s take a look at how the visualization lifecycles (creating/updating/destroying visualizations) in the Visualization API and nebula.js currently compare to each other.
Creating
Both the Visualization API and nebula.js are capable of both rendering existing objects and creating visualizations on-the-fly. The Visualization API method for rendering an existing object starts with its get method, which returns an instance of the QVisualization class. Then the show method of the QVisualization class is used to render the visualization. Creating visualizations on-the-fly with the Visualization API starts with the create method, which, like the get method, returns an instance of the QVisualization class. And again the show method is used to render the visualization. They looks like this.
// The Capability APIs resources must first be loaded

// Get an existing object and render it with the Visualization API
qlik.app.visualization.get(objectId).then(function(vis) {
  vis.show('elementId');
});

// Create a visualization on-the-fly with the Visualization API
qlik.app.visualization.create(type, cols, options).then(function(vis) {
  vis.show('elementId');
});
nebula.js is also capable of both rendering existing objects and creating visualizations on-the-fly. With nebula.js, you first create an embed instance and then use the render function of the embed instance to do both. They look like this.
import { embed } from '@nebula.js/stardust';

// Create an embed instance with nebula.js
const n = embed(app);

// Render an existing object with nebula.js
n.render({
  element: el,
  id: 'abcdef'
});

// Render an object on-the-fly with nebula.js
n.render({
  element: el,
  type: 'barchart',
  fields: ['Product', { qLibraryId: 'u378hn', type: 'measure' }]
});
nebula.js has the advantage of not having to load the resources for the Capability APIs, which includes require.js, jquery, Angular.js, and CSS code. But not all charts may be supported yet in nebula.js. You can check the list of currently supported charts in nebula.js. Of course, you can always create your own chart type with nebula.js too! Then you can register it as an extension, as demonstrated @ Build a HelloWorld extension using nebula.js, or just register it as a chart type and create the visualization on the fly in nebula.js.
Updating
The current functionality between the Visualization API and nebula.js is a bit different from each other as of today. While a Visualization API visualization has the setOptions method available which allows for patching the underlying hypercube and changing various options for the existing visualization, there is no way to change it to a different type of visualization. Conversely, while nebula.js currently has no supported method to patch the underlying hypercube, the experimental convertTo method can be used to change the type of visualization. Let's take a look at an example of both.
// Set new options with the Visualization API
app.visualization.get('xGhjKl').then(function(vis){
  vis.setOptions({title:"Now improved"});
});

// Convert to a different type of visualization with nebula.js
(async () => {
  const viz = await embed(app).render({
    element,
    id: 'abc'
  });
  viz.convertTo('table');
})();
Note that I used a promise chain with the Visualization API example, but async/await with nebula.js. There's no reason for the difference except when I use the Capability APIs it tends to be in older projects where promise chains were the pattern to use with promises, while I tend to use nebula.js in newer projects where I prefer async/await.
Now, even though there's no method on the visualization handle returned by the render function in nebula.js, it can be done using enigma.js. Since the render function returns the ID of the object, we can use enigma.js to get a handle for the object and then use the applyPatches method. That looks like this.
// Render viz with nebula.js, then use the id of the session object
// returned with the viz handle to get a handle of the qlik object
// and patch it
(async () => {
  const viz = await embed(app).render({
    element,
    id: 'abc'
  });
  const obj = await app.getObject(viz.id);
  obj.applyPatches([
    qOp: 'replace',
    qPath: '/qHyperCubeDef/qDimensions/0/qDef/qFieldDefs/0',
    qValue: JSON.stringify('[Field]')
  ]);
})();
And with the object handle, not only can you apply patches such as shown here, but you can use any of the methods available to the GenericObject class of the Qlik Engine JSON API.
Destroying
Both the Visualization API and nebula.js, whether you are embedding an existing visualization or creating a visualization on-the-fly, will create a new Qlik session object. And, especially in a larger app, if you don't clean up, you'll end up with a whole lot of session objects and performance will suffer. Therefore, when you no longer need to render the visualization, whether using the Visualization API or nebula.js, you should destroy it. If you then need to render it later, you can just render it again. The Visualization API uses the close method and nebula.js uses the aptly named destroy method to destroy a visualization. Let's take a look at destroying visualizations with both the Visualization API and nebula.js.
// Close a visualization with the Visualization API
var visRef;
app.visualization.get('xGhjKl').then(function(vis){
  visRef = vis;
  vis.setOptions({title:"Now improved"});
});
if (visRef) { visRef.close(); }

// Destroy a visualization with nebula.js
(async () => {
  const viz = await embed(app).render({
    element,
    id: 'abc'
  });
  viz.destroy();
})();
Notice again, the difference in how promises are handled between the two examples. No reason except it's what I prefer based on the type of web app I'd expect to encounter each one.
Now that we've taken a look at the lifecycle of visualizations in both the Visualization API and nebula.js, tell me what you think. Are you still using the Capability API? Are you already using nebula.js? What kind of things do you want to know how to do with nebula.js? Let me know!
-
Community Redesign - Phase 3
Hello Community Members, We are pleased to announce that we have deployed more improvements to our Qlik Community as part of our redesign project. P... Show MoreHello Community Members,
We are pleased to announce that we have deployed more improvements to our Qlik Community as part of our redesign project. Phase 1, which rolled out in December of 2020, is when we introduced new banner images sitewide as well as design updates to the inner pages. Phase 2, which deployed last month, introduced a brand new home page, a new top level navigation as well as Unified Search. We hope that you are enjoying the updates! Today, our production push includes the following updates:
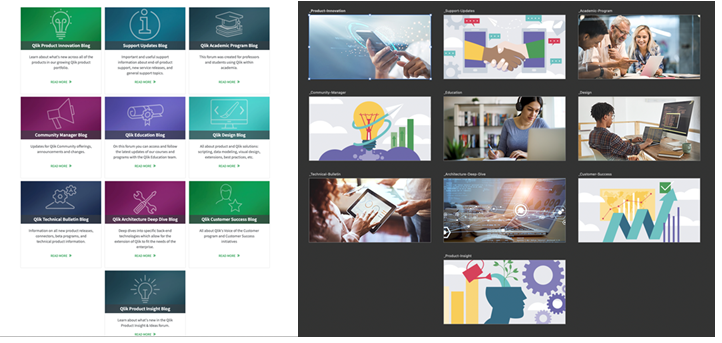
1. New Imagery for Blog Page
We are absolutely in love with the new images designed for our very important Blog page. This design is now in alignment with our home page design. We encourage you to subscribe to blogs as a way to stay current on everything happening here at Qlik.
(old blog page design on the left, new on the right).
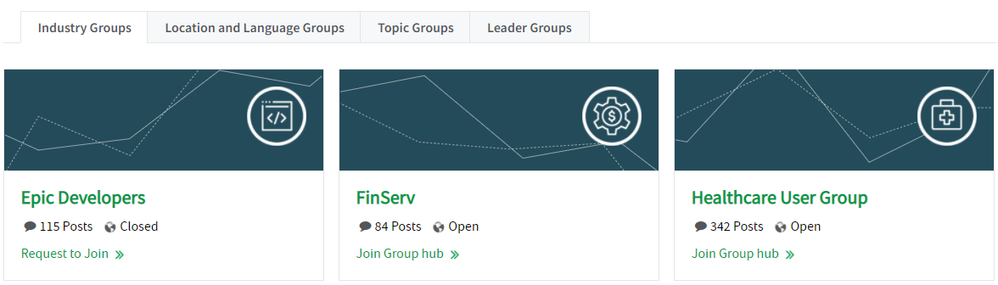
2. New imagery for Groups
Group imagery has also been updated. Page load times will improve second time you load the group pages because images are not cached in the first page load.3. New Imagery on Resources page
If you have not yet bookmarked this page, you should. The resources page will help you navigate the Qlik ecosystem. We hope you find this page useful.
4. New imagery for Support Program - "Qlik Fix"
Qlik Fix is a series of short videos with helpful solutions to common Qlik questions. Subscribing to this page is an absolute "must". A special icon has been developed so you will know when content is connected with Qlik Fix. Thanks to @Troy_Raney and @Andre_Sostizzo for all the great content!
5. An integration with Qualtrics
Rolling out as a pilot phase, and only on our Support Knowledge Base page, you will notice we have removed the kudos/likes (thumbs up) and replaced it with a 5-star ranking. You have the ability to provide feedback to these very important articles in 2 ways (a) as Anonymous Feedback (b) as a comment on post for full visibility.
As Anonymous Feedback: When you scroll to the bottom of an article you will notice the 5 star rating:.
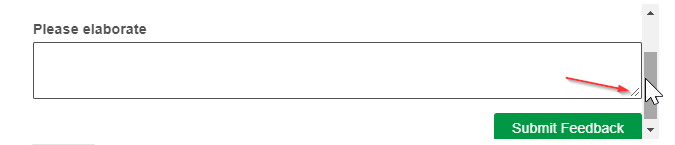
You will be prompted to submit additional feedback, which is optional. Also, you can expand the window in the lower right corner.PS. we know the scroll bar is a bit ... um, annoying but was not a showstopper to push forward. We will work on that.
When you submit feedback using this method it will route to a team that will be reviewing feedback submitted. We thank you in advance for taking the time to provide your input.
You can also submit feedback as per usual, in the comments box - this will be visible to all.
6. Launched! a new forum for Blendr.io
Our community forum for blendr.io is live effective today! You will have a chance to meet new Qlikkies here and fire off your questions about our latest acquisition. Be sure to watch the 2-minute video.
In case you missed the press release, we have included it here.We hope you enjoy these updates. Leave a comment and tell us what you think or if you prefer you can message us directly @Melissa_Potvin @Sue_Macaluso . Subscribe to the Community Manager blog so you can stay informed about future community updates.
See you online!
Melissa and SueRead more about recent design updates:
Community Redesign - Phase 1
Community Redesign - Phase 2
-
Meet Blerim Emruli - A Qlik Professor Ambassador for 2021!
As you may already be aware, we recently announced our inaugural class of professor ambassadors for the Qlik Academic Program. These are a group of se... Show MoreAs you may already be aware, we recently announced our inaugural class of professor ambassadors for the Qlik Academic Program. These are a group of seven educators from all over the world who have made Qlik a central part of their classroom experience for the next generation of analytics leaders, and are keen to inspire students and other educators to understand the importance of Data Literacy.
Over the coming weeks we will be introducing you to each of our seven ambassadors. You will get to know more about their background, why they wanted to become an ambassador with Qlik, and what they hope to achieve as they work with us this year.
We would like to start off by introducing you to Blerim Emruli from Lund University in Sweden. Blerim is a Senior Lecturer in Informatics at the School of Economics and Management (LUSEM), with a research focus on artificial intelligence, decision support systems and business intelligence. He is motivated by the impact that his teaching and courses have upon his students, and the power that data has to transform business and improve society.
Blerim applied to become a Professor Ambassador with the Qlik Academic Program as he is passionate about educating students to be prepared for the data literate workforce by addressing real-world projects and using industry leading tools. “I use Qlik in my teaching, first and foremost, thanks to the Qlik Academic Program and the free resources offered,” explains Blerim. “We use the Qlik software and online training on Qlik products, up-to-date demos, Qlik customer stories, and applicable self-paced courses. The later allows for a flipped classroom or blended learning format, which has been immensely useful during the COVID-19 pandemic.
During some of the computer labs, I invite Qlik instructors to lead the labs virtually, based on the content that we have discussed together and agreed beforehand. Finally, the students are asked to find a data set that is of interest to them in order to complete their group project assessment by making use of Qlik software that many are likely to encounter in a business environment.”
During his tenure as a Professor Ambassador this year, Blerim plans to boost collaboration with the Qlik Academic Program by further integrating our resources into courses within LUSEM in areas such as digital marketing and digital accounting, and the new Master's Programme in Data Analytics and Business Economics which is the ninth most applied for master’s programme in Sweden. Blerim commented, “all this is as a result of some common values I share together with Qlik, like the vision for a data-literate world, where people, businesses, organisations, and governments tackle their most complex challenges with data.”
We are looking forward to working closely with Blerim during his tenure as an ambassador and to creating more links with Lund University, in the city that is the birthplace of Qlik. For more information about our Ambassador Program please visit: qlik.com/us/company/academic-program/ambassadors.
-
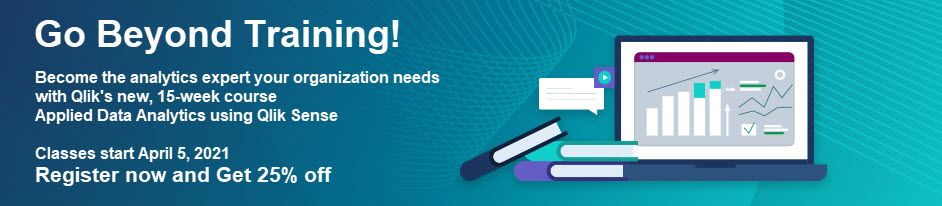
Register Now & Get 25% off Applied Data Analytics using Qlik Sense Course
Feeling the pressure to raise your Data Analytics and Data Literacy game? This 15-week blended course (Virtual instructor-led sessions along with self... Show MoreFeeling the pressure to raise your Data Analytics and Data Literacy game?This 15-week blended course (Virtual instructor-led sessions along with self-paced learning) can help. The course focuses on data analytics and data literacy, and the effective use in a Qlik Sense application. In addition, you will learn the fundamentals of building Qlik Sense apps, visualizations and design best practices.This unique delivery approach will provide you with a collaborative learning environment led by our expert instructors including shared experiences with other customers.
By completing this course, you will learn topics relating to data analytics, data literacy, and data-informed decision-making. You will obtain knowledge on topics addressed in our Understanding Data Principles and Create Visualizations using Qlik Sense courses.
In addition you will obtain the knowledge to be able to take the Qlik Sense Business Analyst Qualification, Data Analytics Certification and Data Literacy Certification.
-
Community Enhancements (2021 - 1)
Hello Members, Following our 3-phase redesign effort we are now focused on site performance. The early part of the year brought many changes to our Q... Show MoreHello Members, Following our 3-phase redesign effort we are now focused on site performance. The early part of the year brought many changes to our Qlik Community including a new Unified Search solution. Read more about the changes that have rolled out.
The month of March we will continue to focus on site performance. In fact, we have already made some significant updates and hopefully you are feeling improvements to page load times. We will continue with this work over the month of March as our priority. Our next major sprint is planned for April 6. Lots of goodies in store for you including bringing Release Notes to Community!
The following minor updates rolled into production on our Qlik Community today, Tuesday, March 2:
(1) Revised Home Page Banner
We have made additional updates to our new and improved home page banner. This iteration is slightly less busy and gives more emphasis to the search bar.(2) New Icon for Qlik Fix now visible in feeds
We are always looking for ways to make it easier for you to find the content you need. The new Qlik Fix icon has been added to the support programs page feed. Qlik Fix is a series of short videos and we encourage you to subscribe to this page.(3) Navigation Improvements
The mobile navigation (hamburger menu) has been aligned to be consistent with our new top level navigation.(4) Ideation Updates
The Product Insight Blog has been archived and has been replaced with Ideation Discussions.
In this space the Qlik team has documented rules and guidelines specific to the Ideation process. Members may use this space to post questions about the ideation process (NOT to request a feature enhancement).
Reminder: Ideation is gated to customers, partners and luminaries.(5) Blog Updates
A 'show more' button has been added to the Blog page allowing for increased visibility to the Blog Feed.
This request came at the suggestion of one of our members and we loved the idea as it is also consistent with our home page.For those of you that have participated in our community survey - thank you. We take all feedback seriously and are grateful you take the time to share your thoughts with us.
See you online!
-
Qlik Sense Enterprise on Qlik Cloud Services Deployment - Tenant and Identity Pr...
Hey Guys - with all the excitement around our new Qlik Sense Enterprise deployment options: Qlik Sense Enterprise on Windows Qlik Sense Enterpris... Show MoreHey Guys - with all the excitement around our new Qlik Sense Enterprise deployment options:
- Qlik Sense Enterprise on Windows
- Qlik Sense Enterprise on Kubernetes
- Qlik Sense Enterprise on Qlik Cloud Services
...I wanted to share a brief video to show you how easy it is to setup a tenant along with an integrated identity provider (IdP) to provide authentication, using Qlik Sense Enterprise on Qlik Cloud Services. (Please note in this video I use OKTA as my integrated IdP but Auth0 is also supported. This video does not go into setting up the actual IdP subscripition so please have that available prior. ) In order to get access to Qlik Sense Enterprise on Qlik Cloud Services please contact your Qlik representative. If you are want to experience Qlik Sense right away you can always sign up for a 30 Day Trial of Qlik Sense Business. To learn more about Qlik Sense Business check out this blog.
First just to recap – Qlik Sense Enterprise on Qlik Cloud Services is a deployment option on Qlik’s multi-tenanted SaaS-based analytics platform. Offering all the great features of Qlik Sense Enterprise on a secure scalable SaaS environment managed by Qlik.
When setting up your tenant and IdP there are few things you should know.
#1 – Once your information has been entered into the Qlik customer system, you should receive an invitation via email to register your Qlik Sense Enterprise tenant. You will login using the email used when registering for a Qlik Account on our web site. The tenant registration process will guide you to select a region for the tenant to operate in as well as create a tenant name for the URL structure that is to be used to access your Qlik Sense tenant.
#2 – you need to have an identity provider (IDP) setup to provide authentication to your Qlik Sense tenant. This can be done currently using Okta and Auth0. This video will focus on Okta, but the steps outlined will be similar. Setting up an IdP is beyond the scope of this video and it is assumed you have the appropriate access and rights to manage it as we will need some information from the IDP environment to setup the tenant.
3# - you will configure your Qlik Sense Enterprise tenant to use the identity provider and will need your IdP client key, client secret from the IDP system. You will also need the OpenID Connect metadata URI from your Qlik Sense tenant used within your IDP configuration as well as a callback URL to be added to your OKTA configuration.
Let's get started.
Please post your questions here and we will address appropriately.
Regards,
Mike Tarallo
Qlik
-
2021 Analytic Trends
1. Moving to the cloud- Cloud technology technology is getting swifter, smarter and flexible, this year saw many organizations moving their data wareh... Show More1. Moving to the cloud- Cloud technology technology is getting swifter, smarter and flexible, this year saw many organizations moving their data warehouses into the cloud or go the hybrid way, i.e. use a combination of cloud and on-premise warehouse. Good thing the #Qlik Academic Program is 100% on the cloud with our software and training!
2. More democratized data-Data is no longer the sole purview of the IT team nor is analytics limited to the CSuite. In 2021, more efforts will be put into seamlessly integrating data platforms, including easy-to-understand visualization boards within an enterprise. The business of self-service analytics tools, too, will continue to grow.
3. Faster, automated AI, ML & NLP- Data modeling will become more automated which helps decrease time to analytics and natural language programming will help translate nature language faster translation of queries into the language needed to obtain results.
4. Customer personalization- Businesses will begin to provide a customized experience during their buys journey.
5. Customer data platforms (CDP)- Are now in high demand. A CDP is a sophisticated data hub where all things related to data converge — from data sources to customer information. It helps track customers foot prints which provides a 360 view to a customers journey.
For the full article visit https://expressanalytics.com/blog/5-key-data-analytics-trends-for-2021/