Unlock a world of possibilities! Login now and discover the exclusive benefits awaiting you.

Analytics & AI
Forums for Qlik Analytic solutions. Ask questions, join discussions, find solutions, and access documentation and resources.
Data Integration & Quality
Forums for Qlik Data Integration solutions. Ask questions, join discussions, find solutions, and access documentation and resources
Explore Qlik Gallery
Qlik Gallery is meant to encourage Qlikkies everywhere to share their progress – from a first Qlik app – to a favorite Qlik app – and everything in-between.
Qlik Community
Get started on Qlik Community, find How-To documents, and join general non-product related discussions.
Qlik Resources
Direct links to other resources within the Qlik ecosystem. We suggest you bookmark this page.
Qlik Academic Program
Qlik gives qualified university students, educators, and researchers free Qlik software and resources to prepare students for the data-driven workplace.
Recent Blog Posts
-
Presenting Datathon Finalists Team Qlik Boom!
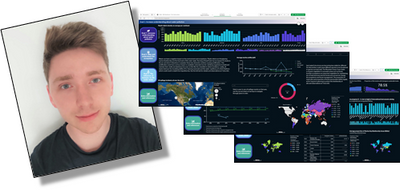
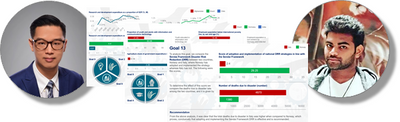
The team is made up of Hari Vignesh and Lok Hin Cheng, both are currently studying a Master of Business Analytics and Big Data degree at the Universit... Show MoreThe team is made up of Hari Vignesh and Lok Hin Cheng, both are currently studying a Master of Business Analytics and Big Data degree at the University of Liverpool in the UK. Hari is from Chennai in South India, which is where he studied for his bachelor’s degree. Following that he worked for Groupon as a customer analyst for 2 years and then spent 3 years at McKinsey & Company as a visual analyst. In November of 2020, he embarked upon his master’s course and made the move to live in Liverpool just a few weeks ago. Lok Hin is originally from Hong Kong but studied for his bachelor’s in Canada before working in a bank for 3 years focusing on loans and trade finance.
Lok Hin Cheng
Hari Vignesh
After finding out about the Datathon in a guest lecture by Qlik, Lok Hin approached Hari to see if he would be interested in entering the datathon as a team. “I was particularly interested in participating as a team, as I enjoy working with others. I believe that you can learn a lot from complementary strengths, and an alternative approach from my own teammate can often spark new ways of thinking for me,” commented Lok Hin.
Hari was also keen to participate in the datathon and despite only having met Lok Hin virtually in a study group he was eager to partner up. “Over the course of the datathon, I was in the final stages of preparation for my move from Chennai to Liverpool, so time management was key to making sure that our application was ready to meet the deadline. The time difference between the UK and India was also a challenge so we were truly an international team,” said Hari.
Both Lok Hin and Hari really enjoyed taking part in the datathon as it gave them the opportunity to practice their Qlik Sense skills using a large, real-life data set. Prior to the Datathon Lok Hin had taken the Business Analyst Learning Plan that was available to him via the Qlik Academic Program. Now that they have had the opportunity to really practice their Qlik Sense skills in the datathon, both are keen to take the Business Analyst qualification as well as more advanced learning modules in Qlik to develop their expertise.
The app that they have developed encompasses all 17 of the United Nations Sustainable Development Goals and looks at how the goals are interconnected. The idea being that if you are trying to work towards one goal e.g. education, there are other goals e.g. industry, innovation, and infrastructure that will impact your progress. The app enables users to explore the progress of countries with different profiles towards each of the goals and to see how progress towards one goal can affect another. You can see a full presentation of the app by Lok Hin and Hari as well as the other finalists at QlikWorld, where you can vote for the overall winner.
Team Qlik Boom initially decided to take part in the datathon simply to learn and to have fun. But now they see presenting at Qlik World as a great opportunity to network and to further improve their knowledge of Qlik and analytics more broadly. Both are hoping that this experience will help them to continue on their chosen career paths after their master’s. Hari is shaping his career to help organizations solve problems and improve business performance as a management consultant across a broad range of industries, and Hin is considering a data analytics career in areas such as agricultural technology and investment banking.
Yuanzhu Zhan, lecturer on the Big Data Management module at the University of Liverpool who introduced the students to Qlik commented: "This event offers students an excellent opportunity to handle uncertainty and implement their new ideas of achieving the United Nations 17 Sustainable Development Goals. It was so encouraging to see our students apply data analytics to identify real social problems and come up with solutions."
To see the datathon finalist presentations at Qlik World sign up for your free seat here: https://www.qlik.com/qlikworld/. And if you would like more information about the Qlik Academic Program for University students and educators please visit qlik.com/academicprogram.
-
Introducing Dongsheng Yuan, Qlik Academic Program Datathon Finalist!
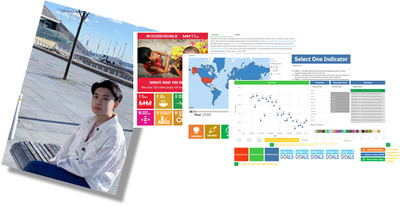
I feel extremely pleased to introduce and share about one of the three finalists of the Qlik Academic Program Datathon, Dongsheng Yuan! Dongsheng is ... Show MoreI feel extremely pleased to introduce and share about one of the three finalists of the Qlik Academic Program Datathon, Dongsheng Yuan!
Dongsheng is pursuing his Master of Science from the University of Liverpool, majoring in Big Data.
He feels data analysis is one of the most important skills for his career and in his words, "data analysis technologies are able to transfer “chaotic data” into useful information. By the help of it, we can foresee what will happen in the future, just like a watcher. It is really cool!"
Dongsheng has participated in various projects in data analytics and among them is a data and algorithm competition held by Tencent in 2019. A major requirement in this competition was to build a strategy to select key opinion roles. That was his first opportunity to work on Tensorflow and Linux. He along with his teammates participated in this competition. Although they lost in the first round, it was a great learning experience in the field of data mining, almost like an adventure! This was the turning point that made Dongsheng want to explore further in data science.
For Dongsheng, the journey for the Datathon began when Qlik Academic Program EMEA Lead, Lucy Bannister was invited to introduce the Qlik Academic Program and the Datathon. This sparked his interest in Qlik because he felt it is a powerful, yet convenient technology. As a student in the data field, having used many tools including Python, SQL, even C++, etc., Dongsheng experienced that Qlik could do all this without scripts. The most impressive feature he felt was finishing a lightweight visualization application on Qlik in only 30 minutes, which otherwise required half a day using Python or R. This further ignited his interest in the academic program and he decided to take part in the Datathon.
Dongsheng took about three days to learn to about the basic features of Qlik Sense such as charts, button, animation etc. He discovered that using scripts in application would make it more attractive. He liked the videos in the academic program, which he feels are great.
Dongsheng says, "The experience of taking part in the Datathon helped me a lot. It provided me with a chance to deal with data about the UN Sustainable Development Goals. And for the past weeks, I have been getting familiar with the visualization techniques. Furthermore, I can handle Qlik Sense now, which means that I can finish a lightweight data related mission within 30 minutes! Those experiences and techniques would be powerful weapons in my career"
Dongsheng plans to be a data analyst and wants to work in a gaming company because he likes playing video games and online games. He feels that using data to adjust properties, avoiding overpowered weapons, for example would be great fun to work!
Check out Qlik World to learn more about Dongsheng's goals, view his amazing application, and vote on your favorite!
-
Sign up for hands-on Technical Workshops at QlikWorld 2021 - Qlik Sense Enterpri...
To access any of the QlikWorld 2021 Breakout Sessions, you must register for the event; and to participate in the hands-on workshops offered this year... Show MoreTo access any of the QlikWorld 2021 Breakout Sessions, you must register for the event; and to participate in the hands-on workshops offered this year, you will have to pre-register to set up your Qlik Sense Enterprise trial environment. You can find the details here.
Find one of interest to you ….
Introduction to Qlik Sense Enterprise SaaS
If you haven't used Qlik Sense Enterprise SaaS, you may assume it's basically the same as Client-managed. But it is so much more - Qlik Sense Enterprise SaaS is a comprehensive environment for data analytics including support for QlikView, Alerting, and many other features! This hands-on walkthrough will introduce you to the capabilities in Qlik Sense Enterprise SaaS available today.
Search for code 487108 to locate the session during the QlikWorld event. hereKeep Your Data Moving with Qlik Replicate and Kafka
Data must inevitably come to rest at some point, but if you are not careful it can get lost or become stale where it lands. “Modern” architectures expect data to be far more dynamic, involving data pipelines where downstream consumers of data make use of data generated upstream. Getting data that has landed in a database moving again and keeping that data fresh in downstream targets can prove to be a challenge.
Join us for this hands-on workshop where you will learn how easy it is to configure Qlik Replicate to move data from a source database into Kafka and other downstream targets and keep that data current by capturing ongoing database changes in real-time.
In this workshop, you will follow a few simple steps to configure Qlik Replicate to move a sample data set from MySQL into PostgreSQL and Apache Kafka continuously as changes to that source data set occur behind the scenes.
Search for code 486319 to locate the session during the QlikWorld event.
Active Intelligence with Qlik Sense Enterprise SaaS
Qlik's vision for the future of BI is Active intelligence. Active Intelligence makes the most up-to-date information available in the most important moment: now. In this session, we will cover several approaches to provide this intelligence to users in quicker and easier ways. This hands-on session will walk you through finding insights in your data using Insight Advisor Search, Insight Advisor Chat and the configuration of business logic used by Insight Advisor. Once you have found those interesting insights, you will be guided on how you can automatically monitor your data using advanced data-driven alerting capabilities.
Search for code 487106 to locate the session during the QlikWorld event. hereGeoOperations - Discover Geospatial Functions in Qlik Sense Enterprise SaaS
In this hands-on workshop you'll learn how to use GeoOperations in the load and the chart scripts and visualize in the map chart. Make the most of your geo investment by connecting Qlik Sense to your existing geo servers and services. Add custom map backgrounds and/or enhance your data model with geo data.
Search for code 486668 to locate the session during the QlikWorld event. here
Introduction to Set Analysis
Set analysis is a way to define an aggregation scope different from your current selection(s). Think of it as a way to define a conditional aggregation. Normally, when you make a selection, aggregation functions, such as Sum, Max, Min, Avg, and Count aggregate over the selections that you have made: the current selections. Your selections automatically define the data set to aggregate over. By using Set Analysis, we can get our charts to show various “sets” of data, for example, predefined time periods such as “year to date”, “last year to date”, specific regions or products). You will learn how to: - Understand the basic concept of set analysis - Know the general components and syntax of set statements - Learn the options for building set expressions - Apply a variety of set expressions in data visualizations
Search for code 487420 to locate the session during the QlikWorld event. here
Head on over to the QlikWorld Community Forum to ask more questions about these sessions and engage with those who are leading these sessions and others!
-
Qlik Academic Program Datathon Challenge Finalists!
This year the Qlik Academic Program hosted another Datathon for students around the globe to leverage Qlik software and develop data and analytic solu... Show MoreThis year the Qlik Academic Program hosted another Datathon for students around the globe to leverage Qlik software and develop data and analytic solutions towards achieving the United Nations 17 Sustainable Development Goals. These goals aim to address poverty, inequality, climate change, environmental degradation, peace and justice, and more.
We received submissions from universities around the globe. We are overwhelmed by the response and are grateful for all students who participated.
Our 3 challenge finalists include:
- Jesse van Haasteren: Team Codecrackers from Universiteit Leiden, Netherlands
- Dongsheng Yuan: Team Data&Dota from University of Liverpool, UK
- Lok Hin Cheng and Hari Vignesh: Team Qlik Boom from University of Liverpool, UK
Join us at QlikWorld Online where you can listen to each finalist present about their solution and then vote for your favorite and help us crown an overall winner!
If you are a student or professor and wish to take part in the Qlik Academic Program to receive free software, training, and additional resources, apply today by visiting qlik.com/academicprogram.
-
Webinar for Qlik Professor Ambassadors
The Professor Ambassador Program of the Qlik Academic Program has come a long way since its launch, and we have on board some amazing Professors in th... Show MoreThe Professor Ambassador Program of the Qlik Academic Program has come a long way since its launch, and we have on board some amazing Professors in the first batch.
Our endeavor is to provide these Ambassadors top class analytics resources to succeed and to be able to impart this information to their students. One such initiative is the Leader webinar series where we invite Qlik leaders to share their insights on analytics or some of the developments around Qlik, technologies, future developments etc. Our aim is to add value to the analytics journey of the Ambassadors and lend a different perspective to their existing knowledge base.
The first webinar of this series was conducted by Kevin Hanegan, Chief Learning Officer at Qlik who spoke on “Uncovering Bias with Data”. It was extremely informative and we received some great feedback from the Ambassadors.
For the second webinar scheduled on 14th May, we have invited Elif Tutuk and Paul Barth from Qlik to share their insights. The overall theme of this webinar is around data literacy and we shall have these speakers speak on their areas of expertise in the context of this theme.
Elif Tutuk is the Vice President, R&D at Qlik. During the webinar, she shall be speaking on Active Intelligence, on how we are designing technology to augment the human with data literacy. She excels in creating engaging user experiences in augmented intelligence technologies. Elif is a prolific speaker and speaks at various events and is a named author on multiple patent applications.
Paul Barth is the Global Head of Data Literacy at Qlik. He shall shed light on some of the initiatives of data literacy and how Qlik is leading this campaign in the world of data analytics. He has considerable experience developing advanced data and analytics solutions for Fortune 100 companies. Paul has research and academic interests and is also a speaker at various events.
This promises to be an exciting session and I am sure the Professor Ambassadors are looking forward to hearing from these two speakers!
To know about Qlik Professor Ambassadors and the Program, please visit: https://www.qlik.com/us/company/academic-program/ambassadors
To know about the Qlik Academic Program and how you can leverage our free analytics resources, please visit: qlik.com/academicprogram
-
Learn about GeoOperations, GeoCoding and GeoAnalytics in Qlik Sense SaaS - Regis...
GeoCoding in action on Qlik Sense SaaS Register now: Did you know you can perform address lookups and convert them to geographic coordinates with Ql... Show MoreResources:- Get started with GeoAnalytics https://community.qlik.com/t5/GeoAnalytics/New-to-GeoAnalytics-Read-this-first/td-p/1565699
- GeoOperations examples: https://community.qlik.com/t5/Documents/GeoOperations-Examples-Qlik-GeoAnalytics/ta-p/1753980
- GeoOperations ref docs: https://help.qlik.com/en-US/geoanalytics/Subsystems/GeoOperationsService/Content/connector/connector...
- Geocoding template https://community.qlik.com/t5/Documents/Qlik-Geocoding-Geocoding-Template-Data-and-presentation/ta-p...
Data
- Open data Hawaii https://geoportal.hawaii.gov/
- Elevation Ranges https://geoportal.hawaii.gov/datasets/elevation-ranges
- Hotels https://geoportal.hawaii.gov/datasets/hotels
- Hazard zones https://geoportal.hawaii.gov/datasets/volcano-lava-flow-hazard-zones
Can't see the video? YouTube Blocked by your organization or region? Download the .mp4 attached to this post to watch on your mobile device or computer.
-
Meet Josué Lima Romano - A Qlik Professor Ambassador for 2021!
Last but by no means least, I would like to introduce you to our final Professor Ambassador of the Qlik Academic Program for 2021, Josué Lima Romano. ... Show MoreLast but by no means least, I would like to introduce you to our final Professor Ambassador of the Qlik Academic Program for 2021, Josué Lima Romano. Josué is a part time Research Professor in Economic and Social Sciences at Universidad de Congreso in Mendoza, Argentina. Currently he teaches on various courses including Governmental and NGO Administration, People Management and Data Analytics. The Data Analytics course is also open to the Community and these classes provide opportunities for underprivileged young people to get free access to university level education. In addition to his teaching Josué is a researcher in the Technology Linkage Unit, and outside of the university he is a consultant in BI solutions.
Josué wanted to become a Professor Ambassador with the Qlik Academic Program because he loved the experience that he had using the program resources while researching financial resilience of communities affected by COVID-19. “I could see the enormous contribution that Qlik was making to the academic world, and particularly to students thanks to the Academic Program and I want to make more people aware of it” said Josué. “When we work as a team, we can achieve results beyond our expectations.”
“We have now moved beyond accumulation of knowledge to application of knowledge,” commented Josué. “and data plays a very important role in this phenomenon.” Josué believes that data literacy skills are vital to the application of knowledge to develop a positive future for all countries. However, Josué could see that in places like Latin America, academic teaching and materials were not keeping up with advances in technology and industry needs in a data driven world. So, he decided to approach companies and organisations to discover how they could work together to ensure that students are best prepared for the modern workplace, and this is how he discovered the Qlik Academic Program. Josué believes that “when companies and academia work together, they contribute to a fairer society, creating a more dynamic labour market with more opportunities for more people.”
As a professor ambassador, Josué hopes to convey the objectives of the Qlik Academic Program to others and to share his experience. He hopes that this will inspire more educators and students to feel motivated to participate in the program. He also hopes that his work with Qlik and other companies can contribute to a paradigm shift to a more equitable society in terms of opportunities, respect and tolerance through data.
We are sure that Josué’s passion and enthusiasm will inspire many other educators to ensure their students are data literate. We look forward to seeing his impact in Latin-America and beyond! If you would like to know more about the Qlik Academic Program as well as our other professor ambassadors, please visit qlik.com/academicprogram.
-
Community Enhancements (2021 - 2)
Hello Members! So much has been happening on the Qlik Community! We just completed a rather large forum consolidation project. This was a two phase ... Show MoreHello Members! So much has been happening on the Qlik Community! We just completed a rather large forum consolidation project. This was a two phase project with many moving parts including content reorganization, forum renaming and in some cases archival. If you need assistance navigating the new structure please do not hesitate to reach out. Here are links to the details:
The following additional updates rolled into production on our Qlik Community, Tuesday, April 6:
(1) Author Stamp
You now can tell when the original author of a post replies back to you. A colorful 'Author' stamp will be added to comments and replies made by the original author. The author stamp will only be utilized in forum boards not document boards or blogs. Don't you just love this update! We sure do! 😎(2) 5 star rating on Knowledge articles
The Support Knowledge Base and respective 5 star rating received an update and is easier to use as the scroll bar, that was there previously, has been removed. The cleaner looking new design renders a simplified and more streamlined appearance. We encourage you to submit feedback and you have a few options for doing so:
(1) The 5 star allows you to submit feedback anonymously.
(2) You can still add comments as a reply to the thread which would remain public.
(3) You can also choose to do both !Please note: we removed the filters for 'most liked' and 'most popular' on this board only - as those filters depend on 'likes' as part of it's algorithm. Kudos or 'likes' has been replaced on Support Knowledge Base for 5 star rating.
(3) Twitter social share (bug fix)
The hyperlink was not rendering correctly when using the social share option for Twitter. The problem was reported specifically within the Qlik Gallery and has now been resolved. If you encounter any issues with social sharing, or anything else, please let us know by reporting it in the Community Corner.(4) Blog Action Tiles added to Category Pages
Category pages are often used as a 'landing page' by which members subscribe. We have therefore incorporated blog action tiles on some category level pages. The embedded nature of the action tile is dependent on where that blog lives within the structure of the community so you may not see this used everywhere (yet). We like this feature as it helps members get to other areas of the community with simplicity. We plan to broaden tile usage on more category pages in the future.(5) Ideation
We gave the main landing page for ideas a minor facelift with new imagery and links to locations for idea boards and tech previews. You will see other pages in the community are incorporating a similar carousel-like design like the Support Programs page. This new design will be added next to Qlik Gallery and then also on the About page.*Reminder: Ideation is a gated area of the community for Customers, Partners and Luminaries only.
(6) Release Notes
As promised in our last update, we have developed a page to house release notes on our community! 😃
Don't worry, older release notes will not be removed from the download site. The page offers filtering options via drop down menus and the actual release notes are attached as a file.The Release Notes page remains a work in progress and it will improve and evolve over time, so by all means consider this v1. I would like to thank @fabrice_lawson for his partnership and also to @Wlad_Masi for bringing the idea to the Qlik Community Team.
Last but not least - very important! Did you register for Qlik World? Qlik World Online 2021 is May 10-12
Register today and use this link!We hope you enjoy this months updates! Our next production push is scheduled for May 4, 2021 and we have many wonderful things coming your way including a refreshed page for Qlik Gallery and something new.... Qlik Greenway!
(I am terribly bad at keeping secrets so please don't message me with questions about what it is! Ha!).Stay safe everyone and look forward to see you all online!

-
Manage performance with the new Application Evaluator available in Qlik Sense Sa...
Performance controls and testing capabilities are critical components for developers and architects in the modern-day. Now with Qlik Sense SaaS, devel... Show MorePerformance controls and testing capabilities are critical components for developers and architects in the modern-day. Now with Qlik Sense SaaS, developers can have these controls native to their workflow, right inside the platform.
The Application Evaluator is one of many investments from Qlik towards strengthening the dev-ops capabilities in Qlik Sense SaaS. Currently on the road is the ability to compare results of the latest evaluation with previous versions - so keep an eye out for what’s next!
Have any questions?
Learn more about governed workflow for developers at Qlik World 2021. Click here or search for session 486456: “Governed Content Workflow for Developers and Consumers.”
Click here to access the video transcript.
How to Trigger an Application Evaluation?
Each Application will have the ability to execute a Performance Evaluation, by selecting the ellipses icon next to the application, you’ll then see the option to ‘Evaluate Performance’.
The most recent and also the historical evaluations from that app can be found in the details section.
The most recent and also the historical evaluations from that app can be found in the details section.
At a glance, you’ll see the most recent and previously ran evaluations with the following details:
- Status of Evaluation
- Start Date of Evaluation
- App Size
- Rows
- Objects
- Results of the Evaluation
By selecting the results icon on the right side, a prompt window will appear providing an overview and details section for the evaluation.
Overview
The Overview will provide important insights on a variety of components like peak memory, application and file size, rows of data, and the number of Public sheets and objects*.
*The Evaluator will only run analysis on Public Sheets and the object found within those sheets.
Details
The Details portion goes deeper and offers details on caching problems, single-threaded performance, load times (Cached & Uncached), resource consumption, and memory allocation. Each section can be expanded to see a list of objects and their response times.
See example image below.
Smooth Linking
To improve user experience, we’ve introduced smooth linking from the results to the application object. When a troublesome object has been identified, a simple click on the link next to the object name will open the application and highlight the object with a blue frame. See example image below.
Embed Results via API
Evaluation results of an application can also be extracted via the API with a JSON file output, enabling any requirements to embed this data elsewhere.
Find out more at QlikWorld during the session on Governed Content Workflow for Developers https://community.qlik.com/t5/QlikWorld/ct-p/qlikworld - presented by our Qlik gurus, Fredrik Lautrup, Magnus Berg and Thomas Hopp.
-
Average – Which average?
If you want to display an average number of something in QlikView, you should use the Avg() function, right? Wrong. Yes, there is an Avg() functio... Show MoreIf you want to display an average number of something in QlikView, you should use the Avg() function, right?
Wrong.
Yes, there is an Avg() function that returns the average value, but – this is usually not the value that you are looking for. The Avg() function returns the average transactional value, whereas you probably are looking for a larger amount.
For example, let’s say that you have an orders database where the grain - the most atomic level – of the data is Order Line. Each order can have several order lines and each order line has an amount. Then, the Avg() function will return the average order line amount, which is utterly uninteresting. No, you are most likely more interested in questions like “How much do we sell per month, on the average?”
In other words – a calculation of an average has an implicit internal grouping entity; the average per month, per day, per order, per delivery or something else. You can look at it as a two-step aggregation:
- Sum all the amounts – per each value of the internal grouping entity (e.g. month, day, order or delivery)
- Calculate the average of the sums from previous bullet.
In QlikView, you would calculate the average monthly sales value in one of the two following ways:
Sum( Amount ) / Count( distinct MonthID )
Avg( Aggr( Sum(Amount), MonthID ) )… and similarly for orders, days or deliveries. Use of the Aggr() function will work, but it is not as fast as the first option, and should therefore be avoided.
Sometimes there are several internal grouping entities. You may for instance want to show the average monthly sales value per customer, i.e. you want to use both month and customer as grouping entity. Then you should use one of the following expressions:
Sum( Amount ) / Count( distinct MonthID & '|' & CustomerID )
Avg( Aggr( Sum(Amount), MonthID, CustomerID ) )The Count() aggregation with a string concatenation will find every unique combination of month and customer.
Note that the internal grouping entity has nothing to do with the dimension you choose to use when you display it. It would make perfect sense to show the above number using Product as the only dimension, as shown in the graph below. Hence, the internal grouping entity is not necessarily visible in the end result.
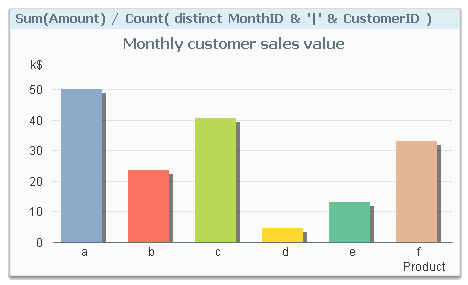
So, you need to figure out which internal grouping entity you want and then use this in a smart way in your expression.
And by the way – an internal grouping entity can be used also for other aggregation functions: Smallest, largest, most common: Min(), Max(), Mode(). But for these, you will need to use the Aggr() function.

-
Meet Javier Leon, a Qlik Professor Ambassador for the 2021 class!
Today, I am honored to introduce Professor Javier Leon as one of the Academic Programs 2021 class of Professor Ambassadors! Javier began teaching Sain... Show MoreToday, I am honored to introduce Professor Javier Leon as one of the Academic Programs 2021 class of Professor Ambassadors! Javier began teaching Saint Joseph’s University in Philadelphia in 2017 and shortly after, he joined the Qlik Academic Program and has been an active member ever since!
Utilizing Qlik Sense and the training provided by the Academic Program has allowed Javier’s students to obtain hands-on experience they can bring to their other business classes and beyond graduation. During his time at Saint Joseph’s University, Javier has embedded Qlik into two courses, Business Analytics for Business Intelligence and Critical Performance Management. His goal in these courses is to teach Qlik but also help the students create visualizations for their portfolios. He believes this will help them showcase their experience while looking for jobs. As an adjunct Professor who uses analytics at work, Javier understands the importance of bringing these skills to the job as he explains “With hands-on experience, students learn how to create different applications. When students leave school, they can show employers that they have experience with one of the most coveted tools in BI.“
To learn more about Javier’s experience with Qlik, both in the classroom and at work, you can read more about his story by visiting empowering-through-bi-in-the-classroom-and-at-work.
Javier’s curriculum has been so well regarded that he has introduced it in other universities! He is now teaching a course called Essentials of Data Visualization at Villanova University and Data Visualization at Eastern University, both headquartered in Pennsylvania.
Please join us in welcoming Javier to the Professor Ambassador Program and congratulating him on his many accomplishments as a professor and Qlik enthusiast!

-
Ptarmigan Labs - Butler SOS open-source monitoring of Sense servers
Butler SOS open-source monitoring of Sense servers
-
Mud crab Analytics Platform
Hi, I wanna show my app regarding analytics in mud crab's growth and production condition with prediction and K-means clustering. -
5 Tips for Qlik Replicate task configuration with MS SQL Server as source
Hello Qlik Users,Looking for some tips on Qlik Replicate task configuration with Microsoft SQL Server as the source? Look no further! A member of the ... Show MoreHello Qlik Users,
Looking for some tips on Qlik Replicate task configuration with Microsoft SQL Server as the source? Look no further! A member of the Qlik Replicate support team came up with these tips for you. Check them out!
5 Tips for Qlik Replicate task configuration with MS SQL Server as source
Is there anything else you would like to see some tips on? Let us know in the comments below!
Thank you for choosing Qlik!
Kind regards,
Qlik Digital Support
-
Contact Tracing with Qlik Sense SaaS - and Active Intelligence Solution
BUT First.....I'd like to introduce you to Tomilayo Komolafe. Tomilayo or as many call him "Tomi", is a Qlik Solutions Architect whom specializes in... Show More
BUT First.....I'd like to introduce you to Tomilayo Komolafe. Tomilayo or as many call him "Tomi", is a Qlik Solutions Architect whom specializes in data science, focusing on statistical modeling and machine learning projects with industry applications. You will see a lot more from Tomi and I as we are teaming up to bring you a new series of Qlik Sense solution-oriented content that focuses on problems, exploration, discovery and outcomes, rather than just presenting features and capabilities. After working together to prepare content, I was extremely impressed with Tomi's real-world in-the-trenches expertise which is invaluable. I'm really excited to be sharing this with you all today and look forward to more in the future. In his debut to the Qlik Design Blog, Tomi brings you a detailed video demonstration of a contact tracing solution running on Qlik Sense SaaS. I first will setup the content and context - the video is below. Enjoy!
What is contact tracing?In public health, contact tracing is the process of identification of persons who may have come into contact with an infected person ("contacts") and subsequent collection of further information about these contacts. By tracing the contacts of infected individuals, testing them for infection, isolating or treating the infected and tracing their contacts in turn, public health aims to reduce infections in the population. Diseases for which contact tracing is commonly performed include tuberculosis, vaccine-preventable infections like measles, sexually transmitted infections (including HIV), blood-borne infections, Ebola, some serious bacterial infections, and novel virus infections (e.g. SARS-CoV, H1N1, and SARS-CoV-2).
The goals of contact tracing are:- To interrupt ongoing transmission and reduce the spread of an infection
- To alert contacts to the possibility of infection and offer preventive services or prophylactic care
- To offer diagnosis, counseling and treatment to already infected individuals
- If the infection is treatable, to help prevent reinfection of the originally infected patient
To learn about the epidemiology of a disease in a particular population
Contact Tracing with Qlik Sense SaaS
Contact tracing is very important in this new era, especially with the re-emergence of COVID across different regions. This demonstration shows how Qlik Sense SaaS makes contact tracing attainable for any organization.
The demo flow:An employee has just been diagnosed with COVID, and once her information is entered into an excel workbook on a shared folder, an alert is immediately created. The corresponding manager receives this alert and further explores this issue using Qlik Sense Insight Advisor Chat. Information obtained is then followed up by a business analyst to act on. The analyst utilizes the Qlik Sense SaaS hub and is able to dive deeper to gain additional insights. The analyst then leverages Qlik's unique associative capabilities to determine what other employees might have also been exposed.
As you will see - Qlik Sense SaaS delivers continuous intelligence derived from data, specifically designed to trigger immediate actions - and this is what we call Active Intelligence.
Contact Tracing Demonstration
(sample data only - no actual employee information was used in the making of this video)Can't see the video? YouTube blocked by your region or organization? Download the .mp4 file attached to this blog to watch on your computer or mobile device.
Contact Tracing: https://en.wikipedia.org/wiki/Contact_tracing
Resources:
Associative Difference: - https://community.qlik.com/t5/Qlik-Design-Blog/A-Practical-Example-of-the-Associative-Difference-Uncovering/ba-p/1552384
-
Free Workshops: Build Your First Qlik Sense App
In this workshop, you will learn how to build a Qlik Sense application and experience some of the functionality and add on products that will increase... Show MoreIn this workshop, you will learn how to build a Qlik Sense application and experience some of the functionality and add on products that will increase data awareness and availability in your company.
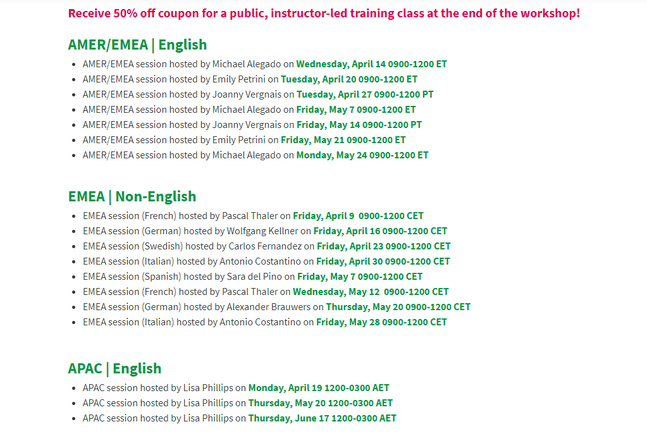
Learn how to accelerate your ramp up and implementation of Qlik Sense through various Qlik training options...with a special offer at the end of the workshop. 3-hour sessions will be held weekly in multiple time zones and languages.
Space is limited, so register today using below link to secure your spot!
Find a webinar that works for you and register today.

-
Qlik DataTransfer™, creating a data bridge to the cloud
For many companies, the full cloud promise is still a work in progress. Many systems are still generating local data, business units or departments ha... Show MoreFor many companies, the full cloud promise is still a work in progress. Many systems are still generating local data, business units or departments have on-premises legacy data that cannot be left behind. With Qlik DataTransfer you can securely push your on-prem data and local files into the cloud.
What is Qlik DataTransfer?
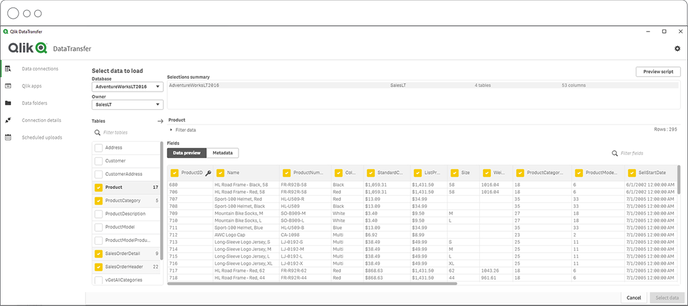
Qlik DataTransfer is a simple (and free) app that brings on-prem data to the Qlik Sense. It will let you securely upload multiple on-premises data such as, Qlik apps (QVF and QVW), data files (XLS, CSV, TXT, and QVD) stored in folders in a file system, and any data stored in on-prem DBMS and so. The new data will be available for use under DataFile space in the Qlik Sense tenant or your preference.
Data Connections. Inspect and select
Qlik DataTransfer lets you look into the existing tables from your on-premises data sources using a familiar and easy-to-use UI. It allows you to select the fields that contain the data you want to transfer to the desired space in Qlik Sense on a set schedule.
At the time of writing this post, the supported data storage systems are: Amazon Redshift, Apache Drill, Apache Hive, Apache Phoenix, Apache Spark, Azure SQL, Cloudera Impala, MS SQL Server, MongoDB, MySQL, Oracle, PostgreSQL, Presto, Snowflake, Teradata, REST, and ODBC.
Note: You can add Qlik Connectors, for example SAP NetWeaver, to expand the available data connections in Qlik DataTransfer
Watch a Folder
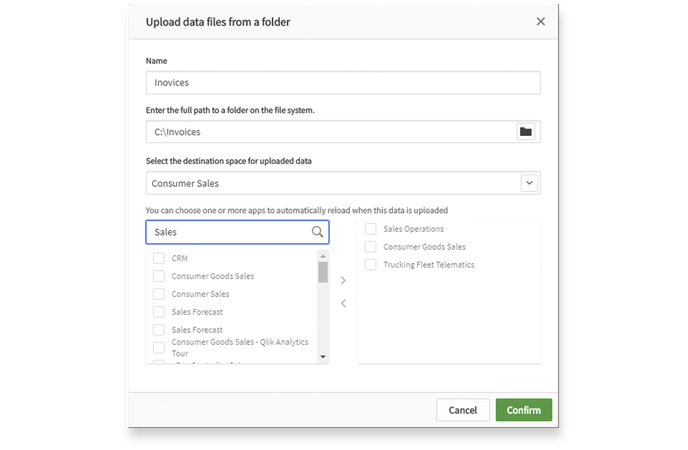
For those of us that have valuable data on the file system stored in files, Qlik DataTransfer offers the ability to watch a folder for new or updated files, and as the files come in or change, it will automatically make the files available in Qlik Sense SaaS.
Additionally, users can select the app(s) they want to be reloaded when new data comes in. So, if there's new data in a folder somewhere in one of your company's darkest on-premise server, then not only the new data will be pushed to Qlik Sense, but any app using that data could automatically be reloaded. Fresh data guaranteed.
Qlik DataTransfer will look for data files in the folder on the file system with the following formats XLS, CSV, TXT, and QVD
Reload = transform + combine
Qlik DataTransfer includes the Qlik Engine, that means that it is capable of reloading a Qlik Sense app, so picture this.
You could normally create a Qlik Sense app with the tool of your choice, or a QlikView app for that matter. You could pull data from multiple data sources. You could create really intricate data transformations and data normalization processes in your app. You could work with Qlik visual data prep and/or with Qlik scripting, just as you do on a regular basis when creating Qlik apps.
This time, though, your app won't need any sheets or visualizations. Your app will be used by Qlik DataTransfer to automatically generate and push QVDs to the cloud.
Refresh data on a set schedule
Qlik DataTransfer offers data upload on a set schedule for Qlik apps and for Data Connections, your data will update whenever you need it. Remember that the Data folders will be monitored for changes, so no need to schedule anything.
Additional resources:
Check out the Qlik DataTransfer quick demo by @Michael_Tarallo
I hope you enjoy Qlik DataTransfer.
Arturo

-
Meet Richard Wilkinson - A Qlik Professor Ambassador for 2021!
Today we will be introducing you to our Qlik Professor Ambassador who is based in the UK. Richard Wilkinson is a Senior Lecturer in Computing at the U... Show MoreToday we will be introducing you to our Qlik Professor Ambassador who is based in the UK. Richard Wilkinson is a Senior Lecturer in Computing at the University of Worcester. He first started working with the Qlik Academic Program in 2019 when he embedded our software and resources into his Data Driven Decisions module and since then he has been a great advocate of the program, encouraging many other staff at Worcester to get involved too.
Richard decided to apply to become a professor ambassador as he is always keen to take part in knowledge exchange and he also wanted to raise awareness of the Qlik Academic Program with other educators. Richard commented: “It’s a great honour to be chosen and a great opportunity.”
As well as wanting to champion the Qlik specific software and resources provided by the Academic Program, Richard is also very mindful of the broader Data Literacy element and addressing the current skills gap. “I think that data literacy is something that every country in the world needs to invest in for its students and we have got a real opportunity to be at the forefront of this,” said Richard. “The one thing that is certain in the future is that the importance of data will only increase, so we need to set students up with the skills to succeed in any career path they choose.” Richard sees data literacy as the next big challenge to face all companies and industries globally. “As there is increasing pressure on organisations to become data driven to survive, there is also increased demand for data literate graduates entering the workforce, and we need to support students to be equipped to meet this demand.”
During his time as a Qlik Professor Ambassador Richard hopes to expand knowledge of data literacy across the University of Worcester and beyond, so that people can build up their skills no matter what subject they are studying. Richard recognises that data analysis is not just limited to the business world but is being used all the time in our day to day lives. “We’re in the world of Covid-19 and pandemics are modelled by data,” he said. “We’ve spent a year watching data slides and modelling and graphics. The medical and sporting worlds are driven by data and, in most fields you go into now, data literacy is crucial so in my opinion we need to be teaching data literacy to all of our students everywhere.”
We are so pleased to have Richard on board to help us achieve our vision of a data literate world, and we are looking forward to seeing how he supports other educators and students on their journey.
-
Get Familiar with Qlik GeoAnalytics - The Binning Operation
Hey guys - thanks for taking some time to learn more about Qlik GeoAnalytics. Continuing my series that will make you more familiar with Qlik Geo... Show MoreHey guys - thanks for taking some time to learn more about Qlik GeoAnalytics. Continuing my series that will make you more familiar with Qlik GeoAnalytics, I'm excited to show you how to use the Binning operation, available within the Qlik GeoAnalytics connector. Think of the Binning operation as a way to cluster or consolidate multiple location points into a defined boundary. When colored by a particular measure, such as count of the number of locations in that particular defined boundary, you can easily see where areas of concern or progress are; allowing you to immediately focus your attention on those areas.
What's Next?
In the next part of this series, we will expand on this example and zoom into the boundary to see the underlying data points. Let me know what you think and please post your comments. If you have specific questions please post them here Qlik GeoAnalytics - our dedicated section in the forums. Myself and others will be available to further assist you.
Qlik GeoAnalytics - The Binning Operation
Regards,
Michael Tarallo (@mtarallo) | Twitter
Qlik
Previous Qlik GeoAnalytics blog posts and videos in this series.
Qlik Geocoding - Street Addresses and Qlik GeoAnalytics
Get Familiar with Qlik GeoAnalytics - Custom Info Bubble
Get Familiar with Qlik GeoAnalytics - The "Closest" Operator
Data:
https://data.cityofchicago.org/Public-Safety/Crimes-2018/3i3m-jwuy/data
NOTE: Can't see the video? YouTube blocked by your organization or region? No problem, just download the attached .mp4 file to watch on your computer or mobile device.
Sample .qvf file attached.