Unlock a world of possibilities! Login now and discover the exclusive benefits awaiting you.

Analytics & AI
Forums for Qlik Analytic solutions. Ask questions, join discussions, find solutions, and access documentation and resources.
Data Integration & Quality
Forums for Qlik Data Integration solutions. Ask questions, join discussions, find solutions, and access documentation and resources
Explore Qlik Gallery
Qlik Gallery is meant to encourage Qlikkies everywhere to share their progress – from a first Qlik app – to a favorite Qlik app – and everything in-between.
Qlik Community
Get started on Qlik Community, find How-To documents, and join general non-product related discussions.
Qlik Resources
Direct links to other resources within the Qlik ecosystem. We suggest you bookmark this page.
Qlik Academic Program
Qlik gives qualified university students, educators, and researchers free Qlik software and resources to prepare students for the data-driven workplace.
Recent Blog Posts
-
Natural Sets
All sets are not equal. Some sets are indeed more fundamental than others. Apart from the two trivial sets {0} (nothing) and {1} (everything), the m... Show MoreAll sets are not equal. Some sets are indeed more fundamental than others.
Apart from the two trivial sets {0} (nothing) and {1} (everything), the most fundamental group of sets are the Natural Sets. These are the sets that can be defined as a selection or through a Set modifier, e.g.
{$}
{$<Country={France}>}
{BM01<Product=>}
Compare these to the non-natural sets, where set operators are used for the set definitions:
{1-$}
{BM01*$}
To understand the difference between the two, you need to know the difference between element sets (lists of distinct field values) and record sets (lists of records in the internal database). See Why is it called Set Analysis?.
Internally, all sets are stored as element sets and/or record sets in state vectors. For Natural sets both the element sets and the record set can be stored, but for the non-natural sets only the record set can be stored. The reason is that there are no well-defined element sets for non-natural sets.
Consider for instance the following table where you want to sum numbers that are not assigned to a customer:
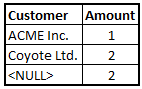
With Set analysis, this is straightforward. The second expression calculates exactly this, using a non-natural set:
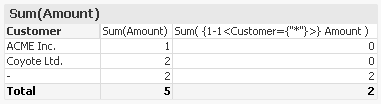
But if you try to create the same filter using a selection in the list boxes, you will find that it is not possible - Null is not selectable.
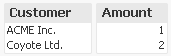
No matter how you select from the two list boxes, you cannot recreate this filter. Hence, a non-natural set cannot always be defined through a selection, and thus cannot be stored as element sets.
From a logical perspective, you could say that Natural sets are always defined by the element sets (the state vectors of the symbol tables), while the record set (the state vector of the data table) is just the result of the logical inference. For non-natural sets, it is the other way around: These are defined by the record set.
This has a number of consequences. First, it is not possible to use a set expression like
{ (BM01 * BM02) <Field={x,y}> }
where the normal (round) brackets imply that the intersection between BM01 and BM02 should be evaluated before the set modifier is applied. The reason is of course that there is no element set that can be modified.
Further, you cannot use non-natural sets inside the P() and E() functions. The reason is that these functions return an element set, but it is not possible to deduce that from the record set of a non-natural set.
Finally, a measure cannot always be attributed to the right dimensional value if a non-natural set is used. For example, in the chart below, you can see that some excluded sales numbers are attributed to the correct ProductCategories, whereas others have NULL as ProductCategory.
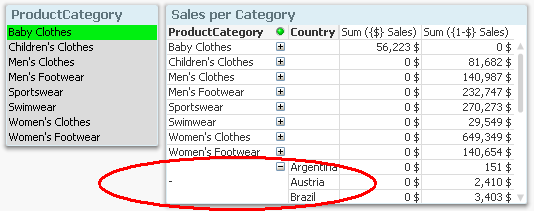
Whether the assignment is correctly made or not, depends on the data model. In this specific case, the number cannot be assigned if it pertains to a country that is excluded by the selection.
Summary:
- Only natural sets can be re-created as interactive selections and stored in bookmarks
- Only natural sets can be modified
- Only natural sets can be used inside the P() and E() functions
- A measure cannot always be attributed to the correct dimensional value if a non-natural set is used
Further reading related to this topic:
Why is it called Set Analysis?

-
qdt-components - React template
On the demo team we end up working with both the Viz API to create and embed native Qlik Sense charts in apps, as well as creating custom components p... Show More
On the demo team we end up working with both the Viz API to create and embed native Qlik Sense charts in apps, as well as creating custom components powered by the Qlik Engine using enigma.js, and we do this in Angular, React, and plain html, as we try to demo all of the ways that Qlik can be used. So after my last blog post (Starter project for developing QAP-powered apps with React and enigma.js) we had an idea on the demo team: let's try to unify all of our different custom components and templates. So we've been hard at work accomplishing that.
You may have seen Yianni's last blog post, qdt-components - A Components Library that can be used in simple Html, Angular 5 and React, introducing this effort. The goal is to have the qdt-components library include custom components powered by Qlik Engine, as well as a way to create and embed native Qlik Sense charts. Right now, the qdt-components library contains a few components, but we're not totally ready to start talking about all of them yet, so we're just sticking to the component that allows you to create and embed native Qlik Sense charts by interfacing with the Viz API.
The big addition since Yianni's post is that we've added a React template, so now we have an Angular 5 template, a plain html template, and a React template, all which load the qdt-components, which is pretty cool. This means that the components only need to be built once, but can be used in a project with almost any frontend stack. I say "almost" because in order to use the component that interfaces with the Viz API there's no getting around loading Angular 1.5 and RequireJS into the global namespace, which means they still have the chance to create conflicts. But you can choose not to use the component that interfaces with the Viz API if you don't have a need for native Qlik charts, and it will avoid loading all of the Capability API stuff, but if you choose to use it, you don't have to worry about writing any of the boilerplate you usually do when connecting to the Capability API.
Documentation, examples, and custom components are coming (and oh yea, we plan on using https://picassojs.com/), but that's the update for now. You can check out the qdt-components library and the templates here - Qlik Demo Team · GitHub. And demos of each of the 3 templates below
Angular 5 with qdt-components
Simple html with qdt-components
-
qdt-components 3.0 beta
We are excited to announce version 3 of qdt-components!If you are not familiar with qdt-components here is a brief intro and I have several links at t... Show MoreWe are excited to announce version 3 of qdt-components!
If you are not familiar with qdt-components here is a brief intro and I have several links at the end of this blog post for more details.
"qdt-components (Qlik Demo Team Components) is a library of components that we have developed in the demo team and that have been used in most of our mashups found in webapps.qlik.com and demos.qlik.com. It's a collection of filters, tables, barcharts, selection toolbars, or even simple getting/creating object methods from the Visualization Api. You do not have to worry about connection strings, loading Requirejs, jQuery etc. Everything is taken care for you! The library can be used in a simple html page by loading the qdt-components.js or in React and Angular2+ via npm."
https://community.qlik.com/t5/Qlik-Design-Blog/qdt-components-A-Components-Library-that-can-be-used-in-simple/ba-p/1465425#v3 is a faster and more modular edition of this library. There are breaking changes, like, before you had to initiate a new class every single time you wanted to use it and create a websocket connection. Now, you load the module that will handle your connection, qdtCapabilityApp for the Capability API or qdtEnigma for the Engine API and then the components you want to use like QdtViz to embed a Qlik Sense object. You pass the properties such as, "id" if you want to embed a single object by id, "properties" with an entire hypercube layout or just a partial one with only the dimensions and measures with QdtPicasso and the library will do the rest.
Here is an example of embedding a Qlik Sense object
const { qdtCapabilityApp, QdtViz } = QdtComponents;
const config1 = {
  host: '...',
  secure: true,
  port: 443,
  prefix: '',
  appId: '...',
};
const capabilityApiAppPromise = qdtCapabilityApp(config1);
const app = await capabilityApiAppPromise;
QdtViz({
  element,
  app,
  options: {
    id: '...',
    height: 400,
  },
});
You can see it live here and even fork it
https://observablehq.com/@yianni-ververis/qdt-components-embed-single-object?collection=@yianni-ververis/qdt-componentsHere is an example using the Engine API and Picasso.js
const { qdtEnigma, qdtCompose, QdtPicasso, useBarChartSettings } = QdtComponents; const config = { host: '...', secure: true, port: 443, prefix: '', appId: '...', }; const engineApiAppPromise = qdtEnigma(config); const app = await engineApiAppPromise; qdtCompose({ element: chartElement, component: QdtPicasso, app, options: { settings: useBarChartSettings({ orientation: 'horizontal', }), height: 400, }, properties: { qHyperCubeDef: { qDimensions: [ { qDef: { qFieldDefs: ['Case Owner Group'] }, qNullSuppression: true }, ], qMeasures: [ { qDef: { qDef: 'Avg([Case Duration Time])', autoSort: false }, qSortBy: { qSortByNumeric: -1 } }, ], qInterColumnSortOrder: [1, 0], }, } }If you are using Qlik Sense Saas, make sure you add the webIntegrationId in your config.
For a full list of what is implemented yet, checkout the collection observablehq.com where you can fork and edit to much your servers, apps, charts etc
https://observablehq.com/collection/@yianni-ververis/qdt-components/Yianni
-
The Magic of Variables
One basic way to assign a value to a variable is to use a Let statement in the script: Let vToday = Num(Today()) ; This will calculate the... Show MoreOne basic way to assign a value to a variable is to use a Let statement in the script:
Let vToday = Num(Today()) ;
This will calculate the expression and assign it to the variable when the script is run. This is exactly what you want if you want to use a variable as a numeric parameter in your expressions.
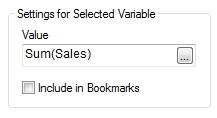
But if you want the expression to be evaluated at a later stage, e.g. every time the user clicks, what should you do then? One way is to store the expression as a string in the variable, using either the Set or the Let statement or by defining it in the Document Properties -> Variables:
Set vSales = Sum(Sales) ;
Let vSales = 'Sum(Sales)' ;
In neither case, the expression will be calculated. The variable will contain the string ‘Sum(Sales)’, which subsequently can be used in an expression using a dollar expansion: $(vSales).
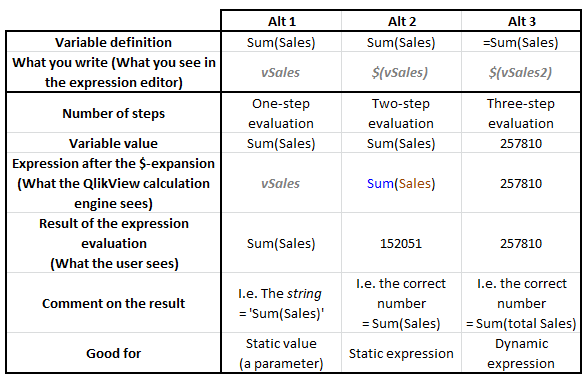
With a dollar expansion, QlikView will substitute the ‘$(vSales)’ with ‘Sum(Sales)’ before the expression is evaluated. Some of you will recognize this as an old style assembler macro expansion. The subsequent calculation will be made based on the evaluation of the resulting expression. Note the two steps: (1) Variable expansion; and (2) Expression evaluation.
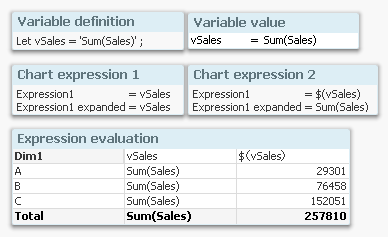
In the chart above, you can see the result of using a normal variable reference (the first expression) or using a dollar expansion (the second expression). In the second expression, the variable is expanded and the numbers are calculated correctly.
But this is just the beginning…
It is also possible to calculate the variable value, i.e. determine how it should be expanded, by using an initial equals sign in the variable definition.
Let vSales2 = '=Sum(Sales)';
In this case, the variable value is calculated after each click, whereupon the dollar expansion in the chart expression is made, and finally the expression is evaluated. This means that the evaluation of ‘Sum(Sales)’ is done before the variable expansion. Note the three steps: (1) Variable calculation; (2) Variable expansion; and (3) Expression evaluation.
The table below summarizes the three methods.
With the above, you can do almost magical things. You can for instance make conditional calculations that depend on e.g. selections, client platform or user.
Example:
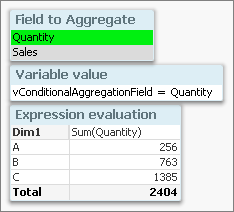
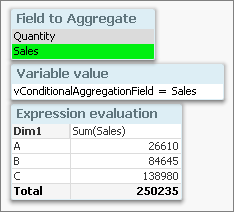
- Create a field [Field to Aggregate] containing the names of two other numeric fields: 'Quantity' and 'Sales'
- Create a variable vConditionalAggregationField = '=Only([Field to Aggregate])'
- Create a chart with an expression = Sum($(vConditionalAggregationField))
The calculation in a chart will now toggle between Sum(Quantity) and Sum(Sales) depending on your selection.
The use of variables is an extremely powerful tool that you can use to create flexible applications. Use it – but with caution. Too much magic behind the curtains can be confusing.
Further reading related to this topic:
-
Qdt-components - latest additions
Qdt-components is a library that we've created to support the Demo Team's work. In the past I talked about how we can use it with various frameworks, ... Show MoreQdt-components is a library that we've created to support the Demo Team's work.
In the past I talked about how we can use it with various frameworks, qdt-components - A Components Library that can be used in simple Html, Angular 5 and React and as a Wordpress plugin, qdt-components - A Wordpress plugin.
I have also shared with you, some of the components with examples on how to use them
qdt-components - Horizontal Barchart by Picasso.js & Selection Toolbar and, Qdt-components & Picasso.js - More Charts! (Custom Selection Toolbar, Picasso Horizontal/Vertical Barchart, Pie Chart, Scotterplot, Line Chart and Combo Chart)
Since then, we have added some more components. Below are the latest additions with their examples on how to use them in your websites. Here are the latest additions with v1.3.5
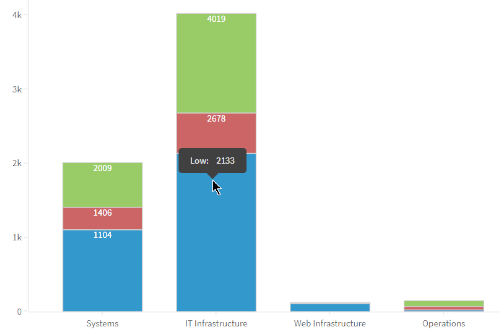
- Stacked Bar Chart (https://webapps.qlik.com/qdt-components/react/index.html#/stacked-barchart)
- How to Embed object from 2 different apps (https://webapps.qlik.com/qdt-components/react/index.html#/embed-object-multi-app)
- Table with the Visualization API (https://webapps.qlik.com/qdt-components/react/index.html#/table)
- Table with the Engine API (https://webapps.qlik.com/qdt-components/react/index.html#/table-engine)
- Search with the results in the dropdown from the Engine API (https://webapps.qlik.com/qdt-components/react/index.html#/search)

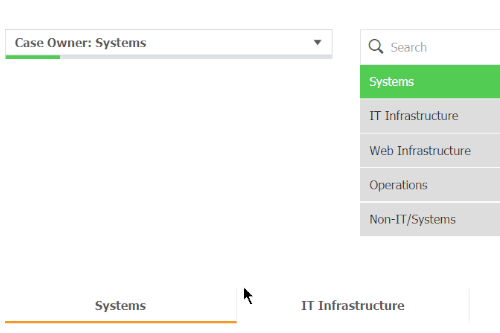
- Custom Filters as a Dropdown, as a list object or as a horizontal tabular menu (https://webapps.qlik.com/qdt-components/react/index.html#/filters) and
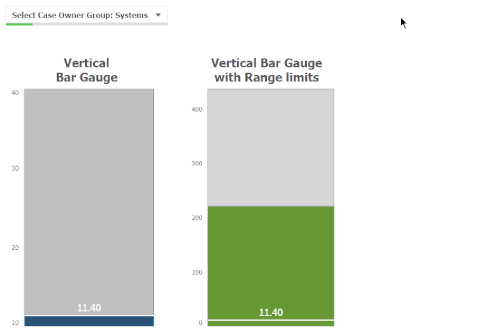
- Vertical Gauge indicators with Picasso.js (https://webapps.qlik.com/qdt-components/react/index.html#/gauge)
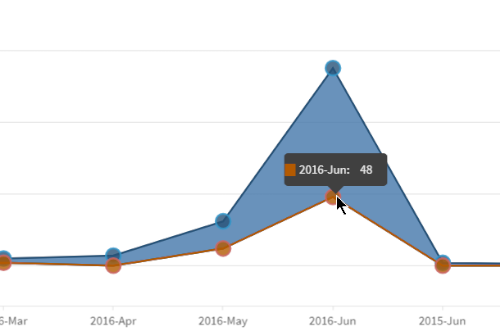
- Range Area with Picasso.js (https://webapps.qlik.com/qdt-components/react/index.html#/picasso-range-area-chart)
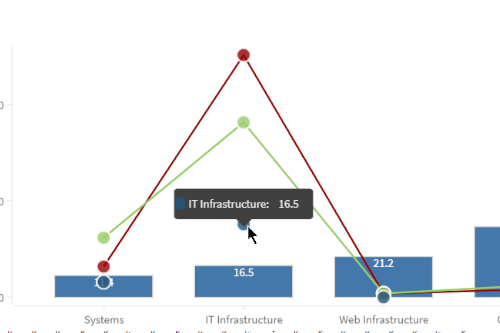
- Create your custom chart based on the already predefined components (https://webapps.qlik.com/qdt-components/react/index.html#/picasso-custom-chart)
Enjoy
Yianni
- Stacked Bar Chart (https://webapps.qlik.com/qdt-components/react/index.html#/stacked-barchart)
-
Painting Qlik Pink for October!
We are Qlik W.I.T. (Women in Technology) We value all of our members regardless of race, gender, sexual orientation, ethnicity or geographic loca... Show More -
Cognitive Engine, Chart Suggestions, Tips and Tricks - Qlik Sense April 2018
Hey guys - I know you will love this blog and video as much as I enjoyed making it; working with this really smart feature in the Qlik Sense April 201... Show MoreHe
 y guys - I know you will love this blog and video as much as I enjoyed making it; working with this really smart feature in the Qlik Sense April 2018 release. Here I will present a new feature made available in Qlik Sense April 2018, Chart Suggestions / Recommendations. If you have tried the Qlik Sense 2018 Technical Preview, then you have already got a glimpse of the power of the new Cognitive Engine. In my opinion the best part of this release are the new capabilities and future possibilities brought about by the new Cognitive Engine. Its main purpose is to streamline and enhance the analytics creation experience - taking you from data to insight in a matter of seconds / minutes. In short the Cognitive Engine leverages best practices, augmented intelligence and perhaps a little elf magic
  - along with your loaded data, to not only recommend data model associations BUT also suggests the best visualization for your data. All you need to do is drag and drop measures and dimensions either on to the design canvas or chart objects and the suggested visualization will display - best depicting your data (no magic words required). Allowing users to focus their efforts on gaining insight instead of building charts. Let me give you a quick demonstration.
You can try this right now in Qlik Sense Cloud!
Can't see the video? YouTube blocked by your region or office? Download the .mp4 to watch on your computer or mobile device.
Sample data attached.

-
Qlik Academic Program expands to more than 400 Universities and Institutions in ...
The Qlik Academic Program has expanded to over 400 universities and educational institutions across India. It recorded a 400% increase in registration... Show MoreThe Qlik Academic Program has expanded to over 400 universities and educational institutions across India. It recorded a 400% increase in registrations from India for the first nine months of 2020, compared with the overall 12 months of 2019. The increase in the number of registrations can be attributed to the growing awareness of data literacy across education institutions, which are adding marketable data skills to their curricula to strengthen their academic offerings
To read more about this piece of news, visit: https://www.financialexpress.com/education-2/qlik-expands-presence-to-over-400-universities-in-india/2097953/
For more information about the Qlik Academic Program and its free learning resources including software, qualifications, certifications, visit qlik.com/academicprogram
-
Introducing the Analytics Modernization Program
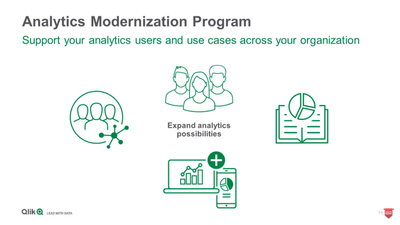
Today Nicole Tamms from Qlik introduces you to our new Analytics Modernization Program. The Analytics Modernization Program increases choice and low... Show MoreToday Nicole Tamms from Qlik introduces you to our new Analytics Modernization Program. The Analytics Modernization Program increases choice and lowers friction for new and existing customers. The Analytics Modernization Program enables customers to deploy exclusively in Qlik's cloud, providing ease of management and a lower TCO. You can also deploy on premise or within private cloud-based based on your governance needs and data requirements, with the option of adding our SaaS to benefit from Qlik's unique multi-cloud architecture.
Watch this brief video where Nicole will tell you more.
-
What Is Being Said? Analyzing Presidential Debate Transcripts
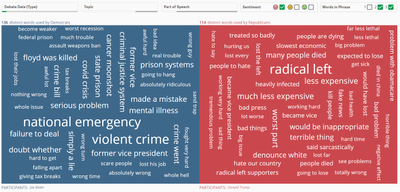
Have you watched any of the debates so far this year? How about the town halls last night? We thought it would be fun to do some debate analysis using... Show MoreHave you watched any of the debates so far this year? How about the town halls last night? We thought it would be fun to do some debate analysis using Qlik Sense, so we did some basic natural language processing on debate transcripts dating back to 1984, loaded the data into Qlik Sense, and created an app to explore what's being said. You can check it out @ https://qdt-apps.qlik.com/presidential-election-2020/. Let's take a look at how we did it.
First, we had to generate some data from the transcripts. Obviously, we wanted who's saying what words, but we also wanted to have some interesting ways to explore the data, so we decided to include topics, parts of speech, and sentiment. We also wanted to include not just single words but bigrams (two-word phrases) and trigrams (three-word phrases). We wrote a python script which utilized NLTK (https://www.nltk.org/) to generate the data and wrote it to CSV files, which we then loaded into a Qlik Sense app.
With our data now in a Qlik Sense app, we used the Word cloud chart that now comes with Qlik Sense in the Qlik Visualization bundle to create a word cloud for each party using set analysis. We then added the fields we wanted to filter on to a filter pane, and were quickly and easily able to start exploring our word clouds.
Then we used the Capability APIs to embed the filters and word clouds into a web app. We thought it would add a bit of fun to create checkbox filters for the "Sentiment" and "Words in Phrase" fields, and if you're interested in how to build checkbox filters like that yourself, I've included the code at the end of this blog post.
And that's it. Again you can find the completed project @ https://qdt-apps.qlik.com/presidential-election-2020/. Play around with it, have some fun, and let me know if you discover anything that's really interesting to you.
Here's the code for the custom filter checkbox component, in case you're interested.
import React, { useCallback, useRef, useState, useEffect, } from 'react'; import PropTypes from 'prop-types'; import { makeStyles } from '@material-ui/core/styles'; import Checkbox from '@material-ui/core/Checkbox'; import { appPromise } from '../config/app'; const useStyles = makeStyles({ root: { display: 'flex', alignItems: 'center', justifyContent: 'space-between', border: '1px solid #ccc', padding: 5, borderRadius: 3, }, checks: { display: 'flex', alignItems: 'center', justifyContent: 'center', }, legend: { marginRight: 5, fontWeight: '700', fontFamily: '"QlikView Sans"', fontSize: 13, color: '#595959', whiteSpace: 'nowrap', }, label: { display: 'flex', alignItems: 'center', marginRight: 5, height: 20, }, }); const useCheckboxStyles = makeStyles({ root: { padding: 0, }, }); const CheckboxFilter = ({ field, labels, hideLegend }) => { const classes = useStyles(); const checkboxClasses = useCheckboxStyles(); const app = useRef(null); const model = useRef(null); const [layout, setLayout] = useState(null); useEffect(() => { (async () => { app.current = await appPromise; model.current = await app.current.createSessionObject({ qInfo: { qType: 'field' }, qListObjectDef: { qDef: { qFieldDefs: [`[${field}]`] }, qInitialDataFetch: [{ qWidth: 1, qHeight: 100, }], }, }); model.current.on('changed', async () => { setLayout(await model.current.getLayout()); }); setLayout(await model.current.getLayout()); })(); }, []); const handleChange = useCallback((event) => { const qElemNumber = Number(event.target.name); model.current.selectListObjectValues('/qListObjectDef', [qElemNumber], true); }, []); return ( <div className={classes.root}> <div className={classes.legend}> {field} </div> <div className={classes.checks}> {layout && layout.qListObject.qDataPages[0].qMatrix.map((row) => ( <label key={row[0].qElemNumber} htmlFor={`${field}${row[0].qElemNumber}`} className={classes.label} > {labels && labels.find((label) => label.qText === row[0].qText).component} {!labels && row[0].qText} <Checkbox checked={row[0].qState === 'S'} onChange={handleChange} name={String(row[0].qElemNumber)} id={`${field}${row[0].qElemNumber}`} classes={checkboxClasses} /> </label> ))} </div> </div> ); }; CheckboxFilter.propTypes = { field: PropTypes.string.isRequired, labels: PropTypes.array, }; CheckboxFilter.defaultProps = { labels: null, }; export default CheckboxFilter; -
Featured Content Friday – Static Content Cache Policy
Hello Qlik Users!Happy Friday! Did this week fly by for anyone else?It’s Featured Content Friday and I’m so excited to share a writer with you all tod... Show MoreHello Qlik Users!
Happy Friday! Did this week fly by for anyone else?
It’s Featured Content Friday and I’m so excited to share a writer with you all today!
He is an Enterprise Architect and has been working as the global lead architect for the past 6 years.
Armand of Tata Consultancy Services!
Armand is a former Qlikkie (he worked on the UK presales team for 3 years) and is currently a Qlik Luminary! Total, he has been using Qlik for 11 years. Armand’s favorite thing about Qlik:
Armand wrote a great piece on scalability and performance optimization, particularly with how Qlik Sense apps are rendered. He takes you on his journey to discover ways to bypass the no-cache policy for static content. Please check out his article* on
*The information in this document is provided as-is and to be used at own discretion. Depending on tool(s) used, customization(s), and/or other factors ongoing support may not be provided by Qlik Support.
Would you like to be spotlighted in a future post? See Introducing Featured Content Friday! for more information on submitting your dashboards, workarounds, how-to’s, and articles.
Thank you for being a part of the Qlik Community and for choosing Qlik!
Kind regards,
Qlik Digital Support
-
The University of Worcester bridges the data skills gap with the Qlik Academic P...
The University of Worcester has successfully implemented the Qlik Academic Program into its Data-Driven Decisions module, to help prepare students for... Show MoreThe University of Worcester has successfully implemented the Qlik Academic Program into its Data-Driven Decisions module, to help prepare students for the future workplace. The module is led by Warren Wright and the Qlik embedded segments taught by Richard Wilkinson, a Senior Lecturer in Computing at the university who first joined the Qlik Academic Program in 2019.
After taking the free Qlik Sense training offered as part of the program himself, Richard decided that it would be useful for his students to get hands-on too. As part of their course assessment, students had to analyse a data set of their choice in Qlik Sense, and to present their discoveries. Chosen topics varied from analysis on how Birmingham City Football Club can maximise ticket revenue, to how companies such as BP and Starbucks can use company data to drive business decisions.
Students have given positive feedback on their first experiences using Qlik, with overall satisfaction increasing to 80% compared to 66.6% in the past when another analytics platform was used. And Richard plans to integrate Qlik into more of his modules for the 2020/2021 academic year. Richard commented “We are all making increasingly more data-driven decisions, so university experiences like this help to prepare students for the digital workplace and enable them to thrive.”
You can read the full case study in the attachment included with this post.
The Qlik Academic Program works to address the analytics skills shortage by providing university students, lecturers and researchers with free Qlik Sense software, training and qualifications to help educate and train the next generation of experts leading with data. If you are a university student or academic looking to up-skill, sign up today! qlik.com/academicprogram
-
Cockpit Performance Management
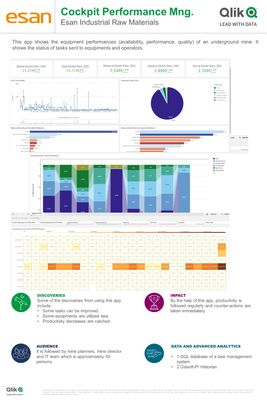
This app shows the equipment performances (availability, performance, quality) of an underground mine. It shows the status of tasks sent to equipments... Show MoreThis app shows the equipment performances (availability, performance, quality) of an underground mine. It shows the status of tasks sent to equipments and operators.
-Task Status
-Outliers
-Heatmap
-Gantt Chart
-
Qlik Sense in 60 - Measure Modifiers
When creating analytics - you may want to use specific calculations within your charts to view your measures differently or possibly even combine... Show MoreWhen creating analytics - you may want to use specific calculations within your charts to view your measures differently or possibly even combine standard aggregated measures ( SUM(Sales) ) with more advanced calculations (Moving Average). Now - this could always be done of course, but you would need to create the specific expression using a combination of available Qlik functions such as RangeSum, Above, Replace along with aggregate functions such as SUM, MIN and MAX, etc. This can get tedious, is time consuming and error prone.
Measure modifiers have been designed to easily add these specific calculations without the need to create these expressions.
Currently there are 4 Measure Modifiers:- Accumulation - see accumulated values of a measure over dimensions.
- Difference - see the difference between consecutive values of a measure.
- Moving Average - see the average values of a measure over a specific period.
- Relative Number - see relative percentages.
We realize the importance of these expressions and how easy they are to use, so we plan on adding additional ones that make sense in future releases.
Watch this 60 second video to see how easy it is to use Measure Modifiers
Learn more:
Don't have access to YouTube? - Download the attached .mp4 to watch on your computer or mobile device.
-
Introducing the Qlik Continuous Classroom Adoption Framework
As a Qlik Continuous Classroom subscriber, we want to you to get the most from your investment with Qlik, maximizing adoption and ROI in your organiza... Show MoreAs a Qlik Continuous Classroom subscriber, we want to you to get the most from your investment with Qlik, maximizing adoption and ROI in your organization.
We have created the Qlik Continuous Classroom Adoption Framework, a five-step guided process, which provides you with FREE learning recommendations, best practices, timelines and other helpful resources to launch Qlik learning to your users.
These resources are most useful for Subscription Administrators, Center of Excellence leaders, or anyone who wants to increase adoption of Qlik Learning in the organization and promote learning of Data Literacy, Data Analytics or Qlik Products but are available to any Qlik Continuous Classroom subscriber.
Visit the Qlik Continuous Classroom Adoption Framework (Log in required) page to learn more. -
How well did your college or university prepare you for the new data-driven worl...
Watch #DataBrilliantUnplugged to find out how Radford University is using platforms like Qlik to upskill students in data. Hear first hand from Prof. ... Show MoreWatch #DataBrilliantUnplugged to find out how Radford University is using platforms like Qlik to upskill students in data. Hear first hand from Prof. Jeff Pittges and two recent graduates - register now

-
Community Enhancements (2020 - 4)
Qlik Community, Many updates have been made to our Qlik Community over past few months. We hope you continue to enjoy all the updates. In 2021 we pla... Show MoreQlik Community, Many updates have been made to our Qlik Community over past few months. We hope you continue to enjoy all the updates. In 2021 we plan to launch ideation so that you can send us your ideas for improvements to the community platform itself. We know this is long overdue.
I am mostly thrilled about our new live events being hosted by Qlik Community team and in partnership with our Digital Support team you now also have a wonderful chance to get to know members of our support team (love that they turn on the video camera!). I'd like to thank my partner in crime @Courtney_Cromley for being a true advocate of community. Also, must thank @sue_macaluso and @Wlad_Masi for helping so much with the execution of each event. Then there is @Jamie_Gregory who works tirelessly to teach, train and explain the rules of the event to all participants not to mention all her product knowledge and by the way, her blog posting is on fire!!! Truthfully, we've been talking about these live events for well over a year now and to see it come to fruition is extremely gratifying. Be sure to check out the Talk to Experts page on our community for details.
- Support Programs
Be sure to subscribe to the new landing page for Support Programs which highlights all the various event and content initiatives being driven out of the support organization. The Support Knowledge Base houses hundreds of 'official' articles authored by Support Engineers and R&D. - Content Archived.
- The Big Data Index forum has been archived
- The Data Market Document board been archived
- Updates to Nav on right rail
- Tag Cloud reduced to 20 tag items displayed
- Community Browser automatically collapsed on default
- *New* Recent Documents displayed as new custom component
4. Round of Applause
Our home page features a new member each month in our 'Round of Applause' series that launched in June.
Meet @swuehl who received the September 2020 Round of Applause .
Head on over to the community corner to read the rest.5. Gamification Update
On the user profile hover-over card, we have updated the way the order of the badges appear so that it is numerical. Now, you can see different badge types in the initial view where previously you may have only seen one badge type.6. Search
We have added Drop-down list to Search Bar in Global Header and below banners site-wide.More improvements coming soon for Search! Stay Tuned for more updates!!!
7. Community Hosted Events
Qlik Community now hosting 'Talk to Experts Tuesday' an event coordinated in partnership with Qlik Digital Support Team. The TTET series has officially kicked off and will run every other Tuesday. A dedicated page has been established so that you can view the calendar of events and listen to prior recordings. Don't miss out on these video chats as you have a chance to ask questions in a live setting while also giving you a chance to meet our team.
- Support Programs
-
Why data literacy should be at the heart of University curricula?
Data literacy is the ability to read, write and communicate with data in context. Nearly every business deals with a large amount of data and, as grad... Show MoreData literacy is the ability to read, write and communicate with data in context. Nearly every business deals with a large amount of data and, as graduates enter the workplace, it should not be taken for granted that data literacy is something that develops throughout their career.
Being data literate will affect the productivity and efficiency of an organisation and so it is no surprise that businesses of all sizes are turning to universities to equip graduates to handle data before they reach their desks.
Qlik's Chief Learning Officer, Kevin Hanegan talks at great length about the importance of data literacy in Universities and why is it important: https://www.fenews.co.uk/featured-article/45322-universities-must-equip-their-students-to-operate-in-a-data-driven-business-landscape
More and more Universities are recognizing the importance of data literacy and analytics as a career of the future. In India, more than 300 Universities and educational institutions have signed up for the Qlik Academic Program to enhance the career prospects of their students
To make your University/College data literate, explore the wide range of resource offered by the Qlik Academic Program including training, qualifications and certifications, analytics curriculum, for free. To know more, visit Qlik.com/academicprogram or write to academicprogram@qlik.com