Unlock a world of possibilities! Login now and discover the exclusive benefits awaiting you.
Qlik Gallery is meant to encourage Qlikkies everywhere to share their progress – from a first Qlik app – to a favorite Qlik app – and everything in-between.

This application shows the evolution of cases over the years, mainly information from Brazil.
This application shows the evolution of cases over the years, mainly information from Brazil.

WHAT IF: you would bet €10 on your favorite sports team for every game?⚽ Would you end up with a profit by the end of the season? Let's find out! What IF analysis in combination with Football Betting Data, visualized using the powerful Layout Container.

Visually show and explain the main join that can be used in script

Access data surrounding the most in-demand Kansas City tech positions Explore the most common tech skills listed on active KC tech job listings Review Kansas City versus U.S. tech workforce data Navigate the distribution of new, active and closed Kansas City tech jobs Compare Kansas City tech median wages in correlation with occupations, employers, certificates, industries, job titles and locations Browse Kansas City tech trend graphs featuring job listings and median wages by month Export custom reports

This app was created as a submission to the May 2024 Qlik Nation Dashboard Challenge, where it was named the winner. It maps various sources of air pollution globally and compares city-level air pollution data to regional averages. The app also examines the relationship between different air pollutant concentrations and asthma rates, utilizing historical data from the World Health Organization (WHO) as the primary data source.
Spotlight Apps
-
Covid cases in Brazil
Covid cases in BrazilCristiano ZilzThis application shows the evolution of cases over the years, mainly information from Brazil.DiscoveriesHelps peopl... Show MoreCovid cases in BrazilCristiano Zilz This application shows the evolution of cases over the years, mainly information from Brazil.
Discoveries
Helps people understand what happened during the pandemic days
Impact
Helps people understand what happened during the pandemic days
Audience
The application is open and can be used by anybody. Especially people from Brazil
Data and advanced analytics
There are some open data sources integrated into the app. That can be consulted and tested. This app incluse, also, many KPIs about risk cases in world and Brazil

-
Air Quality Monitor App
Air Quality Monitor AppSchneider ElectricThis app was created as a submission to the May 2024 Qlik Nation Dashboard Challenge, where it was named the ... Show MoreAir Quality Monitor AppSchneider ElectricThis app was created as a submission to the May 2024 Qlik Nation Dashboard Challenge, where it was named the winner. It maps various sources of air pollution globally and compares city-level air pollution data to regional averages. The app also examines the relationship between different air pollutant concentrations and asthma rates, utilizing historical data from the World Health Organization (WHO) as the primary data source.Discoveries
Users can explore historical air pollution levels in major cities worldwide, comparing them to regional averages. The app reveals trends in air quality over time and helps identify cities with the highest and lowest pollution levels. By analyzing the concentration of specific air pollutants, such as PM2.5 and NOx, users can discover correlations between air quality and asthma rates in different regions. This app also provides insights into the impact of urbanization and industrialization on air quality, allowing users to understand the potential health risks associated with varying pollution levels. Additionally, it highlights the progress made in reducing air pollution in certain areas, offering a comprehensive view of global air quality trends.
Impact
The app has significantly impacted public health awareness by providing easy access to critical data on air pollution and its effects on respiratory health. It has enabled health professionals, policymakers, and the general public to make informed decisions about air quality management and mitigation strategies, ultimately contributing to efforts in reducing pollution-related health risks.
Audience
The audience for this app includes: 1. Public Health Professionals: Researchers and healthcare providers interested in studying the effects of air pollution on health, particularly respiratory conditions like asthma. 2. Policymakers and Government Agencies: Officials who develop regulations and policies to improve air quality and public health. 3. Environmental Organizations: Groups focused on environmental protection and advocacy, using the app to support initiatives for cleaner air. 4. Urban Planners and City Officials: Professionals involved in urban development who need data on pollution levels to make informed decisions about infrastructure and zoning. 5. Educational Institutions and Researchers: Students and academics studying environmental science, public health, or urban planning. 6. General Public: Individuals concerned about air quality and its impact on health, looking for information about pollution levels in their cities or regions.
Data and advanced analytics
The app leverages comprehensive data analytics to visualize and compare air pollution levels across different regions and times. By utilizing advanced analytics, it provides actionable insights into pollution trends and their correlation with health outcomes, enabling more targeted and effective public health interventions.
-
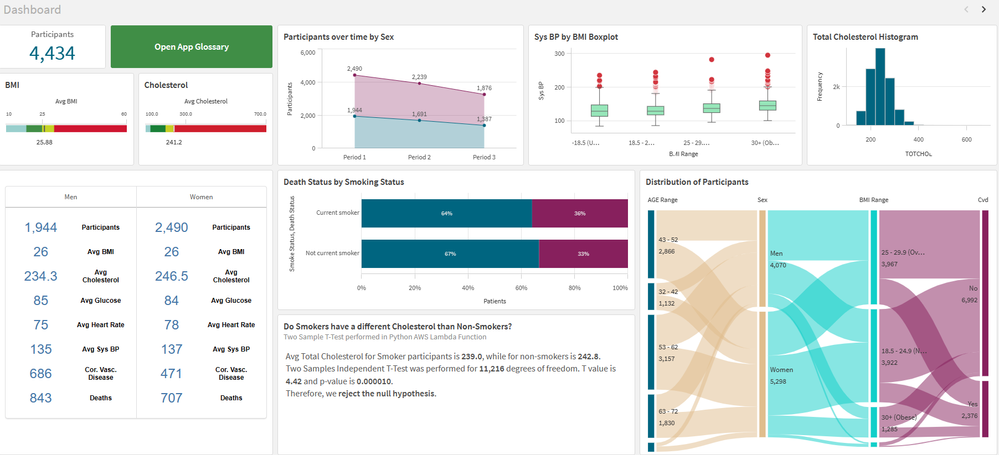
Framingham Heart Study
Framingham Heart StudyIPC GlobalIt shows the data for patients who volunteered to the Framingham Heart Study. I use it for training, demo and explore ... Show MoreFramingham Heart StudyIPC GlobalIt shows the data for patients who volunteered to the Framingham Heart Study. I use it for training, demo and explore innovation.Discoveries
I use this app to explore different features in the Qlik Cloud: hypothesis testing, integration with Python, AutoML, Glossary, Open AI using Rest API (before Qlik had the Open AI connector), AWS Lambda functions and more.
Impact
I use this app for demo and training of my data science and research team. We help healthcare customers in using Qlik for medical research and this app is how I prepare my team and the customer for this complex task.
Audience
People interested in science or medical research, healthcare or integration with different technologies.
Data and advanced analytics
The used is free for educational purposes. It is an anonymized sample of the Framingham Heart study. I also enrich the data with some extra information live CVD risk scores, which was calculated in Python and sent back to Qlik via Qlik API. I has almost all features available in the cloud.


Recent Apps