Unlock a world of possibilities! Login now and discover the exclusive benefits awaiting you.
Data Integration & Quality
Forums for Qlik Data Integration solutions. Ask questions, join discussions, find solutions, and access documentation and resources
Explore Qlik Gallery
Qlik Gallery is meant to encourage Qlikkies everywhere to share their progress – from a first Qlik app – to a favorite Qlik app – and everything in-between.
About Qlik Community
Get started on Qlik Community, find How-To documents, and join general non-product related discussions.
Qlik Resources
Direct links to other resources within the Qlik ecosystem. We suggest you bookmark this page.
Qlik Academic Program
Qlik gives qualified university students, educators, and researchers free Qlik software and resources to prepare students for the data-driven workplace.
Recent Blog Posts
-
Personas in UX Design
When UX professionals get together to redesign a service or product a common practice they will employ will be the use of personas. Personas are repre... Show MoreWhen UX professionals get together to redesign a service or product a common practice they will employ will be the use of personas. Personas are representations of different kinds of people / users of the thing you are redesigning. They are the archetypal kinds of people using the thing you are looking to improve. They are the novices, the savvy experts, the casual users, the die-hard fans, the skeptics, etc. You give them names, you describe what their current needs are, how they use the product today, as well as their expectations for the future.
While you can't please all the people all the time, this exercise forces you to account for a variety of users and to remember that you are designing for a variety of needs and expectations and not just your own. It pushes you to step outside of yourself. Personas have the added benefit of putting a face to a series of requirements. It helps everyone involved keep organized by having a name to go with a list of features & requirements.
So where to begin?
You can start a few ways. If you have the luxury of time & access you can interview stakeholders in the project from a variety of levels. From the hands-off to the hands-on users, from the executives down, you will gain insights from people all along the way. If you don't have that sort of time, brainstorm the kinds of users you are designing for. What will the executive level user want or do with your application? What about the person who is doing the day-to-day maintenance of the app? Create lists of the kinds of users, how they are doing things today, what they want in a future design, what their roll will be, their level of technical sophistication, etc. From here you can begin to design for a variety of consumers.
A word of caution.
Personas aren't real people. It seems obvious but it is worth mentioning. Personas are a great way to get organized and remember to account for a variety of users but they aren't the same as actually testing your design with real people. You should still validate your ideas with a variety of people and see what's working and what isn't. A persona will guide you to a solution but you still need to confirm, with real people, if that solution works.

-
4 tips to start working with QlikView
A few weeks ago a former colleague, who has recently started to work with QlikView, contacted me and was wondering how to start with QlikView and how ... Show MoreA few weeks ago a former colleague, who has recently started to work with QlikView, contacted me and was wondering how to start with QlikView and how to help his team to better visualize data, here are some tips I shared with him that could help you to start too:
1 Find inspiration and reuse
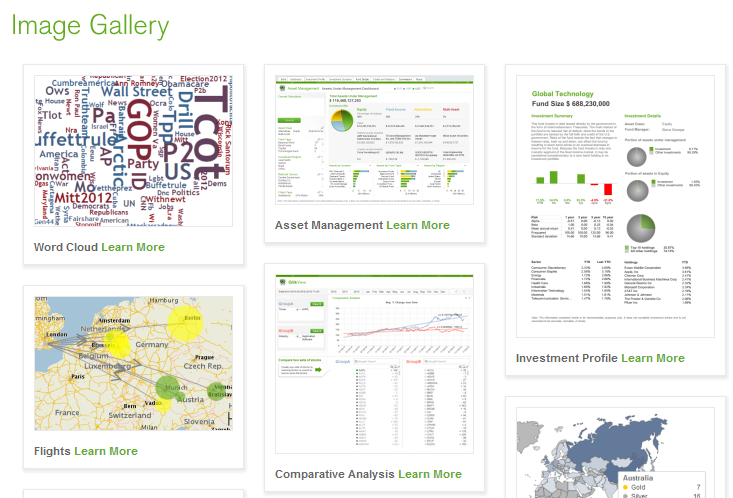
Make sure you visit QlikView Demo site prior to starting your project. One of the best things about the site is the fact that you are able to download one app and reuse the content for your own. Don’t forget to check the brand new demo image gallery with visualization highlights and samples of QlikView’s unique approach to data viz.
If you need advice on when to use which chart, take a look at Data Visualization App, it has specific information and best practices on how to show your data in the most effective ways.
2 Identify the needs
You need to understand the business process that is behind the analysis first. The more you know about the business needs the more easily you will be able to design for the business by choosing the appropriate KPIs. So your first task is to identify the KPIs for your new dashboard and assign them a relative weight so later on you will be able to use hierarchy to emphasize the heaviest, most important ones - this is key.
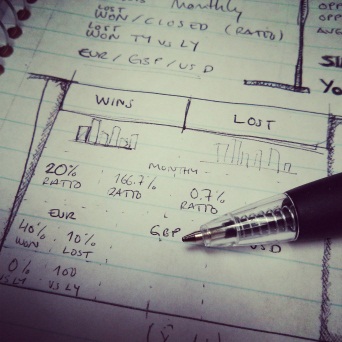
3 Use pen and paper
To create a QlikView app start by picking a piece of paper and your favorite pencil and drawing your best approach to the dashboard, you don’t need to be very specific, just sketch it out and create the basic layout to emphasize the main KPIs and comparisons that are need in your project. Don’t forget to validate your design with other users and add their feedback to your design.
4 Choose a leitmotiv
Think of the fashion designers. They base their collections on a certain decade or style and then they are consistent in applying that style to the entire collection. When working with QlikView you can be a fashion designer in a way, choose a theme, your leitmotiv for the app, and keep it in mind when creating charts and when choosing the color palette. Despite using your corporate branding, it could be a mess if you mix several colors, just keep neutral colors for backgrounds and main elements and use contrast to emphasize the most important KPIs.
Some good examples of thematic design could be founded in QlikView Developer Toolkit App, an excellent starting point for your next QlikView App, you will also find many design elements as buttons, grids, shadows and rulers and lines.
These are just some basic tips to start working with QlikView but if you want to go further in the design process to developing QlikView applications, then you should review Michael’s technical papers you will find at the bottom of his post called How To Improve Your Design Process Working With Qlikview.
Enjoy Qliking!
Arturo Muñoz

-
The Importance of Data Visualization
In 1973 English statistician Francis Anscombe published the paper Graphs in Statistical Analysis to stress the importance of data visualization. He wa... Show MoreIn 1973 English statistician Francis Anscombe published the paper Graphs in Statistical Analysis to stress the importance of data visualization. He wanted to show that graphs are essential to good statistical analysis. Commonly referred to as Anscombe's Quartet, he created four data sets of x & y coordinates whose statistical properties of mean, variance, etc. are nearly identical. He then graphed these data sets as four scatter plot charts and demonstrated just how different the data sets really were.
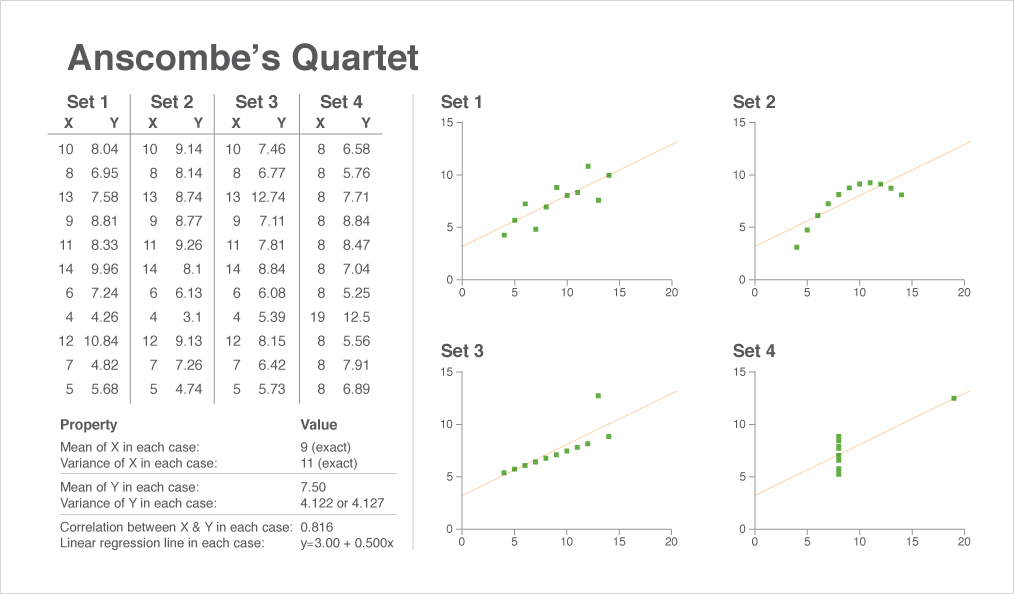
These charts are an integral part of comprehending the data because we can instantaneously see the differences between the scatter plots, a task that would take much longer if we were to rely solely on the data table. The chart and the table are working together to give us the complete story. Anscombe's point was that the chart isn't subordinate to the data table. Both the data table and the chart help the reader understand the data but in different ways.
Good data visualization works because our brains are hardwired to rapidly process visual stimuli using very little conscious effort. Even before actively reading the charts your brain has pre-attentively processed the information to spot the patterns, the similarities and the differences.
So when planning your application consider tables AND charts rather than tables OR charts. They are two ways to learn the complete story in the data.
-
Metadata Management the Customer’s Way - Part 2: The Solution
RecapIn my last article Metadata Management the Customer’s Way – Part 1, I covered a customer’s specific metadata challenge and proposed a QlikView Ex... Show MoreRecap
In my last article Metadata Management the Customer’s Way – Part 1, I covered a customer’s specific metadata challenge and proposed a QlikView Expressor (QVE) solution to address it. To summarize, our customer needed to know which existing QlikView applications (.qvw) were in compliance with the newly established rules appointed by the organization’s Business Intelligence Competency Center.
This article and companion video (below) will provide some details about the proposed solution along with QlikView and QlikView Expressor samples. (attached in this post)
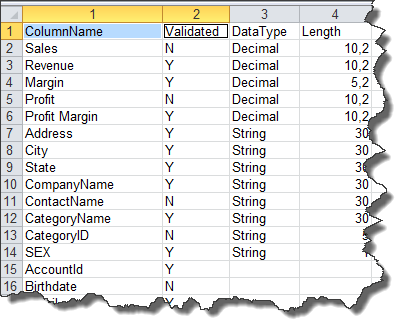
We know from the previous article that the customer’s metadata, such as column labels and validation flags, are stored within database tables as part of their metadata management application. For simplicity I will use an Excel spreadsheet to simulate the customer’s metadata repository and focus on the two fields “ColumnName” and “Validated”.
Leveraging the QlikView Governance Dashboard
I've implemented this solution using data files produced by the QlikView Governance Dashboard (QVGD) scanning process and a QlikView Expressor Dataflow. The QVGD working data files (*.qvx) contain QlikView deployment metadata such as column labels, expressions and field names. Typically, this metadata creates the associative data model read by the QVGD’s information sheets. Leveraging these data files with QVE’s QlikView Read operator provides significant advantages when developing custom QlikView Metadata Management solutions such as this. Since we already have the data files from the QVGD scan, there’s no need to create a custom program to extract QlikView label metadata from the QlikView applications.
The QlikView Expressor Solution
Using the QlikView Expressor Design Studio a multi-step Dataflow can be created that will:
- Extract and load the custom metadata into a QVE Lookup table for later processing
- Read and join the appropriate QVGD data files on their appropriate keys
- “Lookup” what labels have been validated or not
- Provide appropriate business terms to all validated, non-validated and missing labels
- Capture the labels that are not in the custom metadata repository and write them back to the repository for later approval
- Write the results to a new QlikView data file to be used for analysis in QlikView
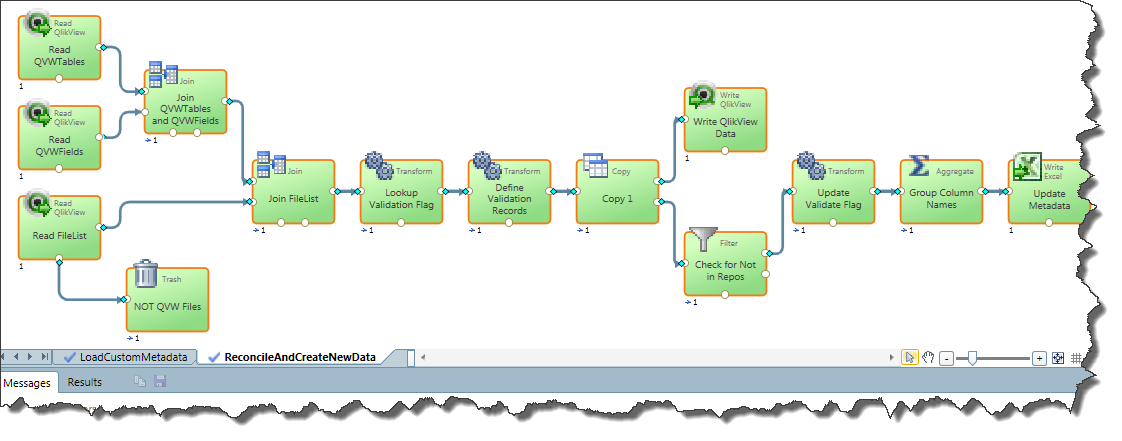
Fig. 1 - QlikView Expressor Dataflow that prepares the data for QlikView analysis and updates the metadata repository
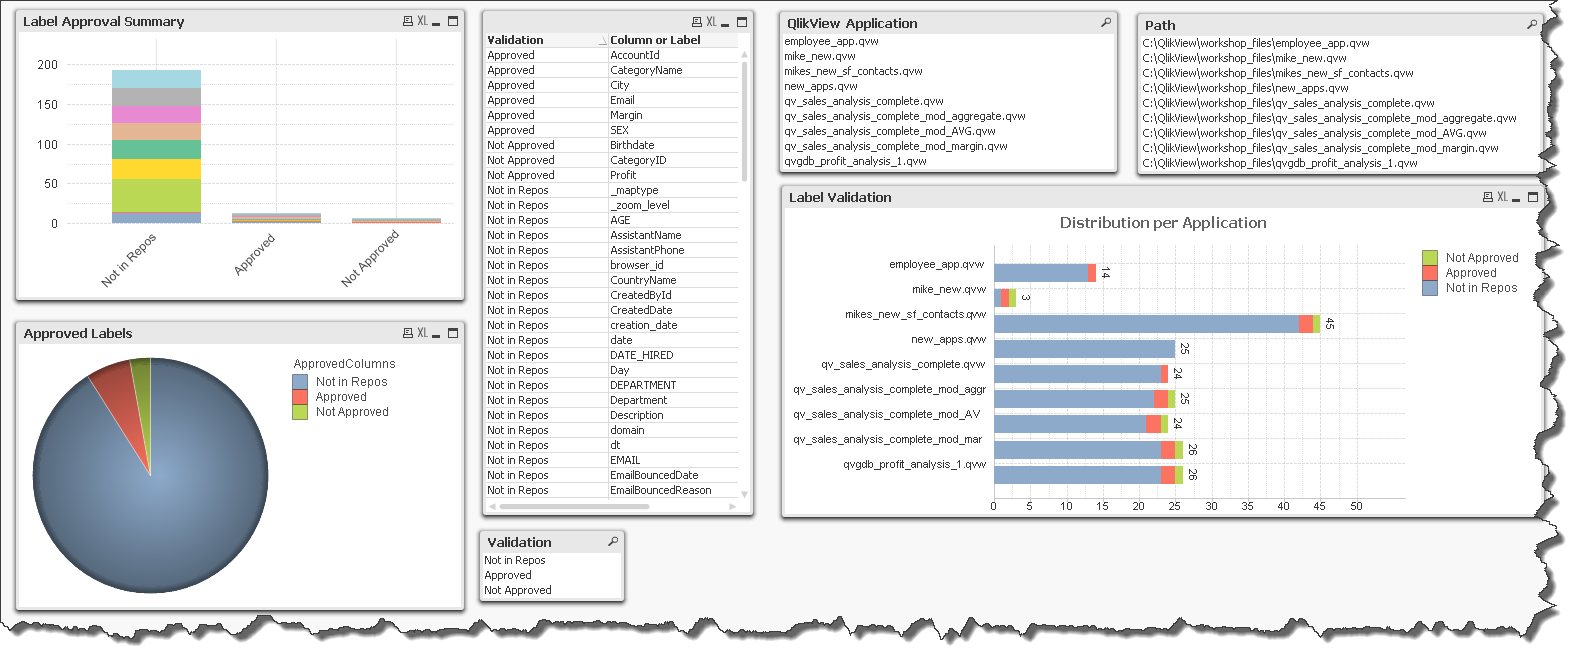
Fig. 2 - Simple QlikView application used to analyze the compliance of the lables used in existing QlikView applications
Review the below video (full screen 480p or higher) to learn more and see the solution in action:
If the video does not display - please use this link: http://www.youtube.com/watch?v=IADq2IT1U6Y
Regards,
Michael Tarallo
Senior Product Marketing Manager
QlikView and QlikView Expressor
-
A Historical Odyssey: QlikView 6 and Multi-threading
Although QlikView 5 was a stable, good version with lots of functionality, it wasn’t good enough for the new hardware that came along. We had already ... Show MoreAlthough QlikView 5 was a stable, good version with lots of functionality, it wasn’t good enough for the new hardware that came along. We had already seen the arrival of the 64-bit Itanium processor and we had responded by developing an Itanium edition. So far, so good. But when we experimented with large data amounts, we realized that although QlikView now could load and address very large amounts of data, QlikView couldn’t process the data fast enough. QlikView needed more processor power. The amount of memory was no longer the limiting factor – instead it was the processor power.

About this time, Intel had just launched its first dual core processors. There were already multi-processor motherboards, but the dual core processors were cheaper and could in addition share cache. The introduction of the dual core processors and QlikView’s need for more processor power forced us to look at how we better could utilize parallel processing.
Hence: Time for a re-write! Multi-threading – here we come.
Already in the QlikView 5 server, there was some basic multi-threading: Each session was evaluated in its own thread. But now, we needed to take multi-threading several steps further; we needed to make the evaluation of every click multi-threaded.
Multi-threading is not easy. The software process needs to have mechanisms that can determine that one thread should be split into several, and other mechanisms that merge several threads into one. The threads are asynchronous and sometimes a thread needs to stop and wait for the result of another thread. This means that you can get situations where two threads wait for each other. So you also need mechanisms to avoid such deadlocks.
Anyway, we re-wrote large parts of the code and when we released QlikView 6 in the spring of 2003, it was multi-threaded.
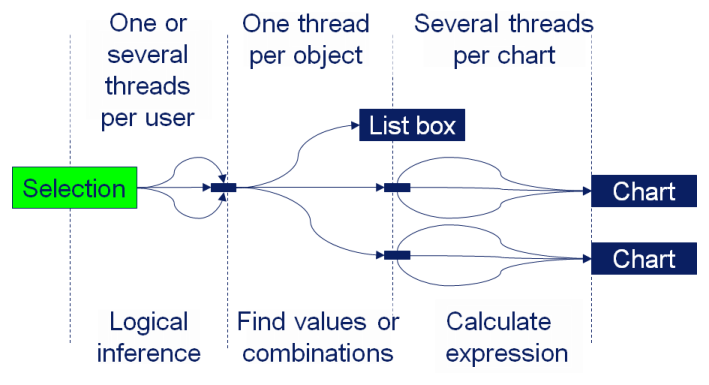
In the solution, the logical inference for a single click is multi threaded and the evaluation of several threads are merged together to form the final result. After the logical inference, the sheet objects need to be calculated. Each object is then a thread of its own that subscribe to all changes in the data model. “Subscribe” means that it is re-evaluated every time there is a change in the selection state. In addition, the chart engine is multi threaded, so that if an aggregation is made over a table with a large number of records, different parts of the table are aggregated in different threads.
QlikView 6 also brought the LEF files, which enabled Client Access Licenses (CALs) for the server. It also brought the qvp protocol, the plug-in client, the OCX, the table viewer, copy and paste objects, the layout themes, semi transparency (GDI+), the color functions, variables in the layout, the grid chart, the gauge chart, the radar chart, the slider object and the language dll:s.
We also introduced different license levels for the stand-alone version of QlikView 6: Enterprise, Professional and Analyzer, so that a customer could have different capabilities for developers, power users and standard users.
QlikView 6 should be remembered for bringing the multi-threading that we use still today. This is the core of the modern QlikView that can use the power of today's multi-core hardware.
Further reading on the Qlik history:
A Historical Odyssey: QlikView 5 and the Rainbow Border
A Historical Odyssey: QlikView 7, QVD files and the Aggr() function

-
Wildcard data loading (*.blah......)
Regularly in a QlikView application, you need to load from a directory or set of identical files which simply have different file names but contain th... Show MoreRegularly in a QlikView application, you need to load from a directory or set of identical files which simply have different file names but contain the same type of data. For example, log files generated by systems contain the same type of data in a set structure, but the filenames often reflect the time and date or the system the log file was generated from.
In this blog, I will show you how to (really simply) load in to QlikView, a set of files that are identical in makeup but are not named the same.
So, imagine we have a directory full of log files on your server as below...
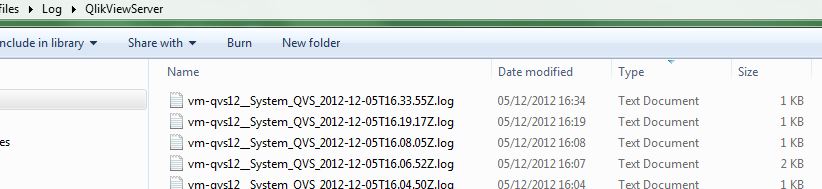
I need to load all of these log files in to my application, but I do not want a single load statement in my script for each of the 100+ files. So, firstly we need to perform a standard load from our table (.log) files. When you have done this using the qlikview script editor, you will have a simple load statement...
LOAD Sequence#,
Timestamp,
Level,
Hostname,
Logger,
Thread,
Id,
User,
Exe_Type
FROM
[vm-qvs12__Application_QVS_2012-12-04T13.25.38Z.log]
(txt, codepage is 1252, embedded labels, delimiter is '\t', msq);So this statement would load all of the columns listed from the specific file in the FROM statement. However, we want to utilise one single LOAD statement for all of our log files. By simply changing the filename to contain an asterisk, provided all of the columns that you are placing in your load statement exist in all of your files, using an asterisk will cycle through all of the .log files that start with the text "vm-qvs12__Application_QVS_" in the directory, and load the data in to your application.
example:
FROM
[files\Log\QlikViewServer\vm-qvs12__Application_QVS_*.log]
(txt, codepage is 1252, embedded labels, delimiter is '\t', msq);Now we have all of the data in our application, we may want to know from which log file the data in the application came from. So, we can use some functions to give us some extra data.
We can use the Filebasename() function to give us a column in the data that contains the filename of the loaded log file.
LOAD filebasename() as SourceFilename,
Sequence#,
Timestamp,
Level,
Hostname,
Logger,
Thread,
Id,
User,
Exe_Type
FROM
[files\Log\QlikViewServer\vm-qvs12__Application_QVS_*.log]
(txt, codepage is 1252, embedded labels, delimiter is '\t', msq);Now, that was a simple example of the wildcard load. What if I wanted to load data from multiple files and enhance the script with something like a preceding load? To do this I would have to utilise a simple function/variable and a small loop. In the example below, you can see that I am loading from multiple xlsx files, again using the filebasename function, but I am also creating a column called Total in my preceding load. The For Each and Next keywords tell QlikView to loop through the files in the location that conform to the wildcard in the Filelist function.
For each vFile in FileList('C:\Users\aby\Desktop\*wildcard.xlsx')
Load Col2+Col3 as Total,
*;
Load *,
Filebasename() as Source
from [$(vFile)]
(ooxml, embedded labels, table is Sheet1);Next vFile
Hopefully I have managed to simplify some of the scripts you use today!
ABY
-
QlikView 11.2 is available!
Yesterday we announced QlikView 11.2. The main new feature in this release is QlikView Direct Discovery. With this exciting feature, QlikView does not... Show MoreYesterday we announced QlikView 11.2. The main new feature in this release is QlikView Direct Discovery. With this exciting feature, QlikView does not require loading all data into the QlikView in-memory engine anymore. QlikView Direct Discovery is a hybrid approach that leverages both in-memory data and data that is dynamically queried from an external source.

Some of the main benefits of QlikView Direct Discovery are:
- Consolidate relevant data from multiple sources, including Big Data repositories
In addition to the current decision support environments like EDW, data marts and operational data stores, organizations are now also considering the big data storage environments, such as Hadoop, BigQuery or Teradata etc. The challenge is enabling business users to analyze data from all of these data sources in the same analytics application. QlikView Direct Discovery offers a hybrid approach solving this challenge. It allows users to seamlessly run queries on the big data stores while they do discoveries on the data extracted from their ERP systems, data marts, EDW or even from their excel files into memory.
- Maintain associations among all the data, regardless of where it is located
The level of details that is stored in the big data stores is usually very granular. Business users need an easier navigation means in this bulk of data. QlikView Direct Discovery leverages associations in the data, making extremely large datasets manageable.
For example, a policy analyst who uses a QlikView app to analyze regional loss and revenue information on a daily basis, would know the region names, but he would not have any clues on the specific policy numbers for these regions. With Direct Discovery, he can select the regional info, as he would do every day, and QlikView would automatically associate and query the billions of policy-level information on the big data store and display the query results with the in-memory metrics on the same QlikView app for the selected region.
- Access Big Data without complex data modeling or programming
It is very easy to use Direct Discovery feature on a QlikView application. The only thing that is changed is to use “DIRECT SELECT” on the load script instead of using “SQL SELECT”. This new keyword would indicate QlikView that the data source is a direct discovery source. In this case, QlikView would only load the field names and will bring the data to the user interface when a direct discovery field is used on a QlikView chart. More information on the technical aspect of this feature can be found in this technical addendum paper. A how-to video is also available here.
Please note that QlikView 11.2 is a new release of QlikView, with one new feature, QlikView Direct Discovery. Please read the QlikView 11.2 Release Note document that is available on the download site before upgrading to QlikView 11.2 to learn more about the release and some of the bug fixes with this release. With this release, the QlikView 11 branch will be stopped and new service releases will be made for QlikView 11.2 instead. For more information on this subject, please contact the QlikTech Support team.
Since we announced this new feature in October, we have seen great excitement in our customer and partner community as they see the potential of QlikView 11.2 enabling Business Discovery with Big Data, without any data size limitations. QlikView 11.2 is now available on our download site if you also would like to expand your business discovery capabilities on the data sets that were previously used separately, or not used, because of their bulk and the development effort required!

-
Holiday Gift! - Organize the files on your machine
Do you use the generic search engine on your OS to find the document you are looking for? Have you had any luck finding it within one minute? Well, ... Show MoreDo you use the generic search engine on your OS to find the document you are looking for? Have you had any luck finding it within one minute? Well, I haven’t. So I decided to go back to the old fashion way. QlikView way. The associative way.
Here is my background. I use Windows, so I search for something like “How QlikTech uses QlikView” in “Search programs and files” box above the “start” button.

This is where the disaster begins. It found 1,270 items. I know I didn’t make that many documents with that name. What it’s finding is all the files that contain at least one of the key words in the file name, including as an attachment to emails. It also searches for the content of the document. It’s overwhelming to find what I am looking for from this long list, but Windows doesn’t give me an option to filter by a document type or by a folder these ppt may belong to.
I just needed a way to simply find my files in my folder by the name and not the content . So I created this application called Find My Files.qvw. If you’d like to try it, download the app and specify the root directory in the box and hit “Reload” button in QlikView. If you start with the highest hierarchy directory, it may take longer than expected depending on the number of files you have. For example, I have 106GB used in my C: drive, and I care about only what’s in my user folder. So I loaded all the files in that folder, which is 37GB in total. It took only 1 minute to read in all the files. If you don’t want to read all the files, you can specify the extensions in the loop such as qvw, xls, xlsx, doc, docx, ppt, pptx etc. The reload time will be faster, especially if you are reading the entire hard disk.
The script of this app is pretty simple, and it is one of the help sample codes. Many people may be already familiar with it.
Using this app, I know there are 18 files in my machine for “Making a good design great” ppt and not 1270.
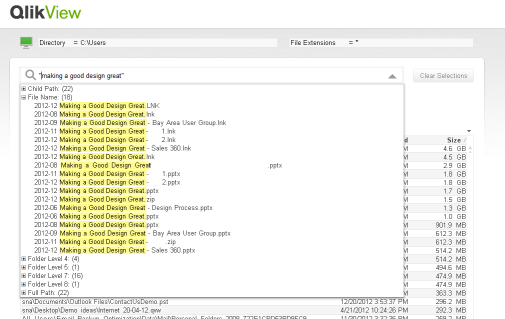
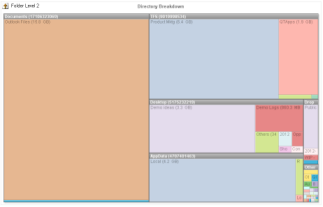
Yes, there are various desktop search software available out there, but why is this app any better? This app also helps you organize your hard drive. For example, when you are running out of disk space and need to know which folder is consuming the most disk space, you may want to know which folder I can consider eliminating. Windows Explorer doesn’t give you the folder size, so you need to right click and see the properties to see how large the folder is. If the folder is 10GB, you sit and wait for the properties box to appear. Bummer. Use this application, and you will be more efficient with your work life.
Download this application and the technical brief from here.
Ho Ho Ho… Happy Holidays to you (belated)!
Shimanta (Shima-Santa)

-
Helping Hands
The holiday season is often a time when we consider our blessings, our shortcomings, our needs, and the needs of others. As a special Christmas blog ... Show More The holiday season is often a time when we consider our blessings, our shortcomings, our needs, and the needs of others. As a special Christmas blog post, I felt it may be good to share my experiences working with Tiny Hands International (THI), a non-profit organization that works specifically with orphans, street children, and sex-trafficking victims. It was an eye-opening experience for me that gave me insight into the needs of the victims as well as the organization itself.
I was having lunch several months ago with the founder of THI, John Molineux, who is a good friend of mine from college. At one point in our conversation, John expressed that they had been looking for a good way to analyze the data they collect when they intercept trafficking victims at border checkpoints in Nepal. Each year, 10-15,000 women are deceived and trafficked out of Nepal where they are then sold as sex slaves. More specifically, John mentioned to me that they had been hoping for a tool that would allow them to visualize the paths the victims take when they are trafficked. This could be useful in identifying the most commonly used routes, and it could perhaps give insight into how they could best focus their efforts. Of course, I knew QlikView could be a great help to them, and we got to work loading THI’s data. Once they identified the paths of the victims geographically in the data, it was easy to use a map extension to visualize the paths, drawing the more highly traveled paths with thicker lines:
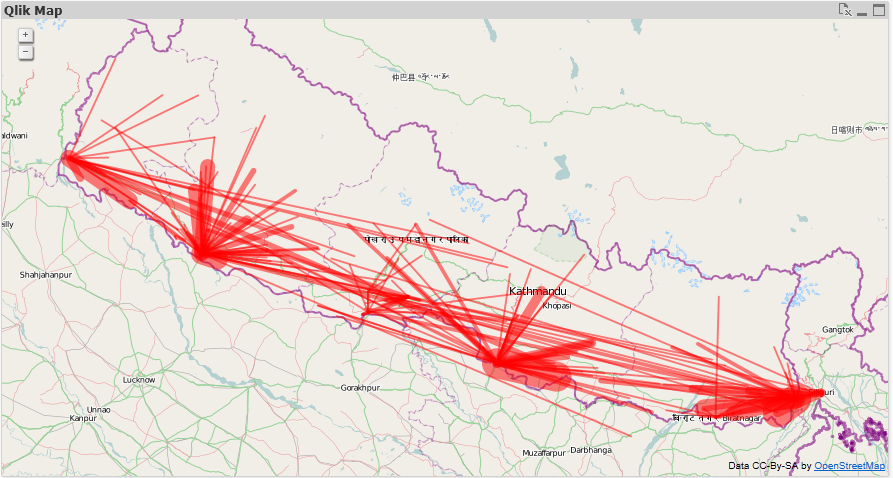
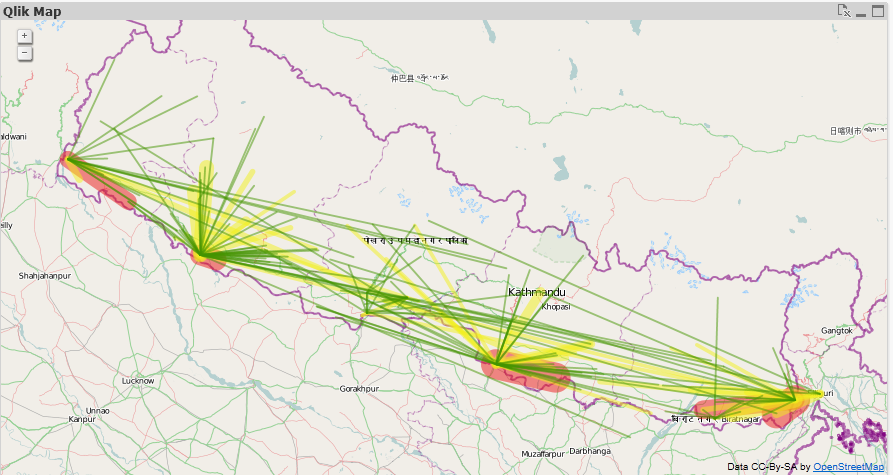
The data is very raw, and THI is thinking of ways to optimize their collection and identification of paths, but even so, some trends and useful information can be seen with the map. For example, the dark red area on the east side of the map shows that a lot of activity is occurring at this checkpoint, including some of the thicker lines. Of course, using QlikView’s associative filtering, we can choose to display only the top 15 routes:
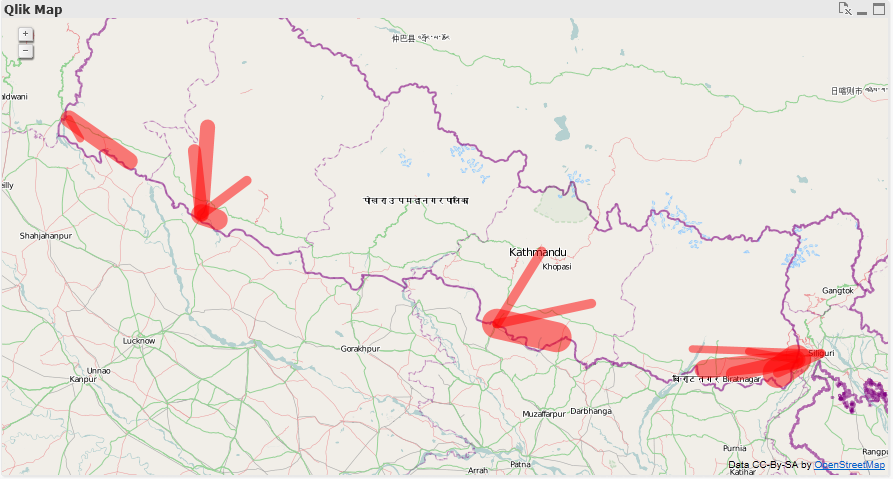
Or focus in on a specific border checkpoint like the eastern one I mentioned earlier:
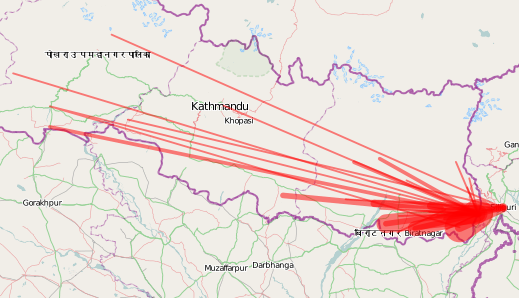
We were also able to use an expression to color the most traveled routes in red, while coloring the less traveled routes in yellow and green:
Overall, we were very excited to see start seeing the story the data was telling us, and ideas were flowing on how they could further optimize their data collection and leverage QlikView’s analysis in their planning.
What I realized in working with Tiny Hands International is that charity organizations are businesses too. They also need the ability to analyze data and be as efficient as possible. Knowledge is power after all, and wasted time, money, and resources mean a less effective fight against injustice.
More than that, working with THI was a staunch reminder for me that there are people in the world right now doing selfless honorable work to improve the plight of their fellow humans. Oftentimes I sit at my warm desk feeling separated from this world, but I hope that as I'm humbled through experiences like this, I will consider the ways I might help to affect positive change in the world.
If you’d like to support the work of Tiny Hands International, please go to their website. A small gift from us could have a large impact on those in need.

-
Roman Emperors and the Month Names
Our current month names come from the Roman calendar. The original Roman calendar had ten months: Martius, Aprilis, Maius, Junius, Quintillis, Sextil... Show More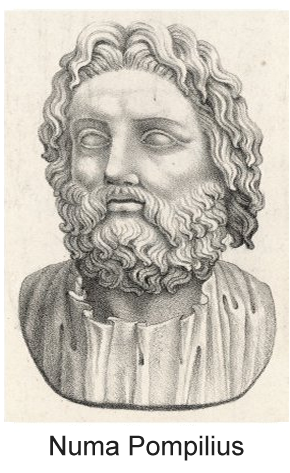
Our current month names come from the Roman calendar. The original Roman calendar had ten months: Martius, Aprilis, Maius, Junius, Quintillis, Sextilis, September, October, November and December. The first four months were named after gods: Mars, Venus (Aphrodite in Greek and Apre in Etruscan), Maia and Juno. The origin of Aprilis is debated, but we know that the month was sacred to Venus because the Festum Veneris et Fortunae Virilis was held on its first day. The last six months are based on the latin words for five, six, seven, etc.
Each year started in March and ended in December, 304 days later. It was then followed by a period of festival between the years.
But the calendar was soon changed by the king Numa Pompilius around 700 BC, who added Januarius (after the god Janus) and Februarius (after the purification festival Februa). He also moved the beginning of the year to Januarius.
However, the year was still too short - only 355 days - so the Pontifices occasionally had to add an extra month to keep the calendar in sync with the seasons. This decision was political and was sometimes done just to extend the term of a particular public official. Or it wasn’t done at all, if the official was an opponent.
 By the 1st century BC, the calendar had become hopelessly confused, so in 46 BC, Julius Caesar initiated a reform that resulted in the establishment of a new calendar, the Julian, which was a vast improvement: Leap years were introduced and the year in the Julian calendar was on the average 365.25 days, so no extra intercalary month was needed. After Julius’ death, the month of Quintilis was renamed Julius in his honor, hence July.
Julius Caesar was succeeded by Augustus, and after his death the senate renamed Sextilis after him. At the same time, the senate also suggested that September be renamed after the reigning Caesar Tiberius. But Tiberius refused with the words: “And what will you do if there be thirteen Caesars?”
Today most countries use the Gregorian calendar, which is based on the Julian and still has the Roman month names from 2000 years ago.
In QlikView and in Qlik Sense, the abbreviated month names are defined in the environment variable MonthNames.
Set MonthNames = 'Jan;Feb;Mar;Apr;May;Jun;Jul;Aug;Sep;Oct;Nov;Dec';
This variable is used by several functions, e.g. Month() and Date(). The format code ‘MMM’ is always mapped against the content of this variable.
You can also create an environment variable for the long month names, corresponding to the format code ‘MMMM’:
Set LongMonthNames =
'January;February;March;April;May;June;July;August;September;October;November;December';If you have these variables, you can use the long format codes not only for formatting of date fields, but also for interpretation of fields, e.g.
Date(MonthStart(Date),'MMMM YYYY') as YearMonth, // Creates and formats YearMonth
Date#(Date,'MMMM DD, YYYY') as Date, // Interprets the Date='October 9, 2012' as a date
Dual(MonthTxt, Month(Date#(MonthTxt,'MMM'))) as Month, // Interprets the MonthTxt='Oct' as a monthBottom line: You should define fields for months in your master calendar and add an environment variable for long month names.
Further reading related to this topic:
-
Version 11 Service Release 2 Update 2 is now available for download
Hello everyone,We are pleased to announce that Version 11 SR2 Update 2 - build 11.00.11440 is now available. This Update replaces Update 1 (11.00.11... Show MoreHello everyone,
We are pleased to announce that Version 11 SR2 Update 2 - build 11.00.11440 is now available. This Update replaces Update 1 (11.00.11426). Unfortunately Update 1 contained two degrades which affected users of Windows XP and Windows Server 2008 (not Server 2008 R2).
We regret the inconvenience caused. You can download the installation files for Update 2 from http://www.qlik.com/download.
Please see attached release notes for further information.
regards,
Global Support Team

-
Tool vs. Toy
Back in 2001, with the release of the now cult-classic film Donnie Darko, there was a website that came out to accompany the film. The site was (and i... Show MoreBack in 2001, with the release of the now cult-classic film Donnie Darko, there was a website that came out to accompany the film. The site was (and is) as cryptic and vague as the movie. There is this quasi linear path through the site but at the same time no clearly delineated objective - you experience the site and you do so just for the sake of experiencing it. It doesn't need to tell you what theaters the movie was being released in, or when it was being released because you could get that information other places. This site was for enthusiasts, for die-hard fans. It was something to play with that added to the richness of the film by extending the experience of the film.
Now contrast this with a site that sells movie tickets. There is a clear objective. You use it to buy tickets online to save you from having to buy tickets in person. I go to these sites with a purpose, I complete my task, I leave. It's a tool to do a job.
The balance between creating a tool vs. creating a toy isn't always this clear. You want to create a pleasant experience, even something cool, but if the primary objective is to enable people to complete a task then you should focus on building a useful tool. Help your users do the thing they came here to do. In the case of QlikView this means building applications that focus on the user's needs, apps that clearly show the data, that help users explore their data and find new insights.
I've seen more than a few applications where people, with the best intentions, tried to create a fun environment but ended up adding too many pieces of unnecessary visual "flare." When considering a background, a chart, an animated logo, or a photograph you need to ask yourself: "is this going to help people use this application?" If the answer is no, then perhaps it is best left out. There are plenty of well designed applications that take a very minimalistic approach to design. The application should be well designed, but well designed this isn't synonymous with having a trendy aesthetic. You don't need to cram in all the design tricks you know.
Real design solves problems and the application you are building should be a tool to help people solve problems and complete tasks.
-
Tips and Tricks – Pixel Perfect or QlikVew Natural
Have you ever received a design and wonder how you were going to replicate it in QlikView? Well, I came across this challenge when creating the Socia... Show MoreHave you ever received a design and wonder how you were going to replicate it in QlikView? Well, I came across this challenge when creating the Social Media Data Analysis demo. Our UI designer designed a chart that that looked something like the image below:
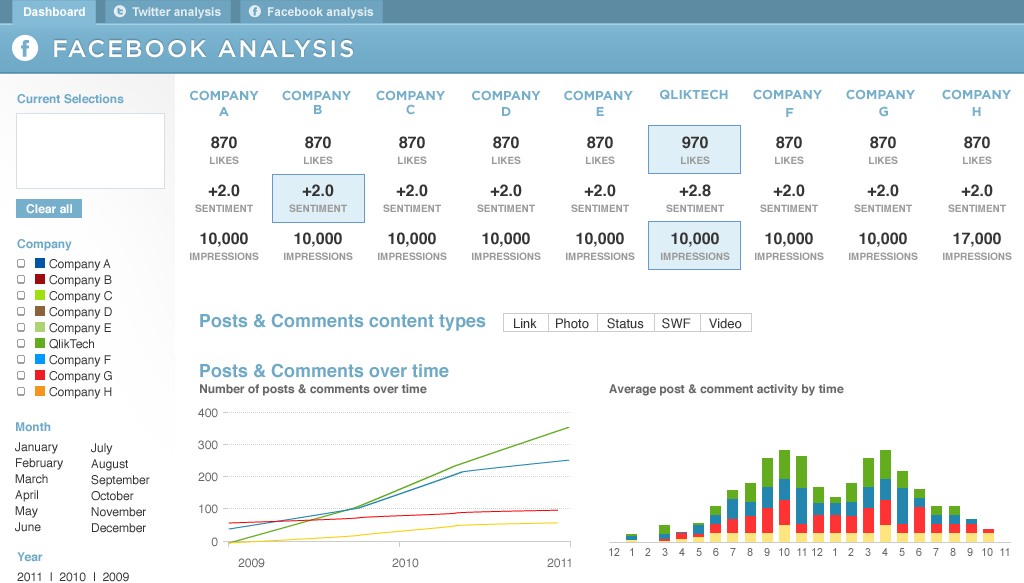
Now at first glance, you may consider designing this in QlikView using individual text objects for the labels and expressions. That was my first thought but then I realized that there would be a lot of text objects to maintain when changes were made to the expressions. So I tried to recreate this chart using a pivot table. While it was easy to add the dimension and the three expressions, it was a little more difficult to add the perks like a background color for the highest value but only for selected companies. For example, in the chart below, Company A, Company C and Company D are selected so I only want to see the highest values based on those selections.
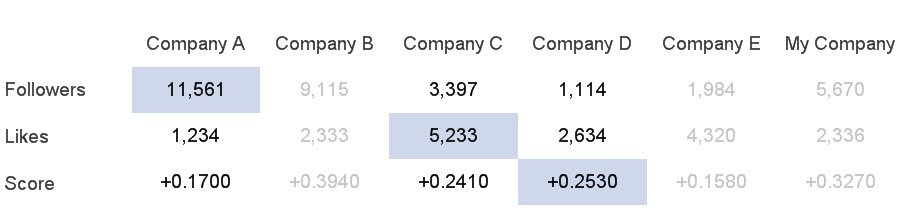
There were also challenges like the dimension label and background color or the fact that the background color for Company A Followers extended to the left to the label. It was little things like this that made this chart a challenge.
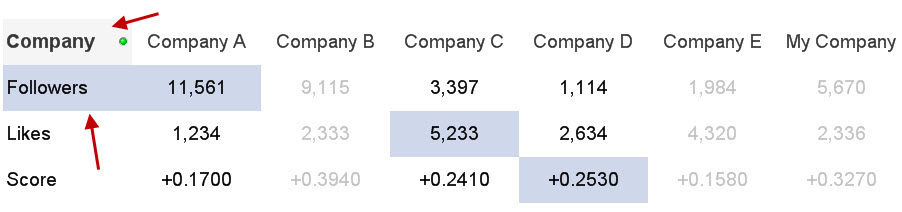
But with the use of set analysis, background colors, text color and some carefully placed text objects, I was able to create a visualization that was not as pixel perfect as the Photoshop design but close to it using the basic features and functionality of QlikView. Read more about how I created this chart in this technical brief.
-
Version 11 Service Release 2 Update 1 is now available - build 11.00.11426
Hi everyone,We are pleased to announce that the latest Update release for version 11 is now available for download from http://www.qlik.com/download .... Show MoreHi everyone,
We are pleased to announce that the latest Update release for version 11 is now available for download from http://www.qlik.com/download .
Please refer to the release notes for details on fixes included in this Update. Always follow industry best practices when updating your software!
regards,
Global Support Team
-
Ancient Gods and Modern Days
The use of the seven-day week is ancient. Signs are found in the old Greek, Indian, Persian, Babylonian, Jewish, Akkadian and Sumerian cultures. Most ... Show More The use of the seven-day week is ancient. Signs are found in the old Greek, Indian, Persian, Babylonian, Jewish, Akkadian and Sumerian cultures. Most likely it was invented by the Sumerians around 4500 years ago.
The Sumerians named the week days after the celestial bodies: The sun, the moon and the five known planets. Since the planets had names after gods, some days were thus also named after gods. These names were then translated into Babylonian, then into ancient Greek. In both translations the corresponding local gods were used.
Set DayNames='Nanna;Gugalanna;Enki;Enlil;Inanna;Ninurta;Utu'; // Sumerian
Set DayNames='Sin;Nergal;Nabû;Marduk;Ishtar;Ninurta;Shamash'; // Babylonian
Set DayNames='Σελήνης;Ἄρεως;Ἑρμοῦ;Διός;Ἀφροδίτης;Κρόνου; Ἡλίου'; // Greek
Set DayNames='Moon;Ares;Hermes;Zeus;Aphrodite;Cronos;Sun'; // GreekThe Romans, however, did not initially use a seven-day week. But a decision by Emperor Constantine in AD 321 eventually established the seven-day week also for the Roman Empire. Once again the names of the gods were translated to their local counterparts:
Set DayNames='Lunae;Martis;Mercurii;Iovis;Veneris;Saturni;Solis'; // Latin
Hence, the Latin names of the gods were mostly translations of the Greek names, which in turn were translations of the Babylonian names, which go back to the Sumerians. The Latin names can still be recognized in most Romanic languages, e.g. in French:
Set DayNames='Lundi;Mardi;Mercredi;Jeudi;Vendredi;Samedi;Dimanche'; // French
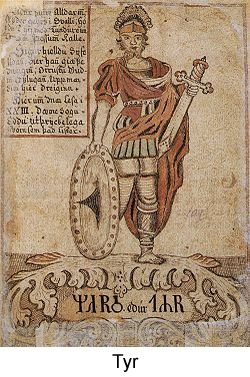 The Germanic tribes in northern Europe started to use the seven-day week long before they converted to Christianity, so the day names, except sun day and moon day, have the names of the old Germanic gods: Tyr/Tiw, Odin/Wotan, Thor/Donar and Freyja/Frige.
But for Saturday, the day was not translated. It is still “Saturn’s” day in e.g. both Dutch and English. And in all Nordic languages it is the “Washing day”. Because that is what you were supposed to do on Saturdays.
In QlikView, you can customize the day names by changing the variable DayNames as I have done above. These values will then be used by the WeekDay() function. Alternatively, you can create a new variable, e.g. vDays, and use this in the following field definition:
Dual(Subfield('$(vDays)',';',WeekDay(Date)+1),WeekDay(Date)) as WeekDay
But on which weekday does the week start? And which week is the first week of the year? The ISO 8601 defines these things clearly:
- The week starts on a Monday
- Week no 1 is the first week of the year with four days or more.

This means that if Jan 1st is a Friday, then week no 1 starts Monday Jan 4th, and the first three days of the year belong to the last week of previous year. It also means that if Jan 1st is a Thursday, week 1 starts Dec 29th. The ISO 8601 is used in many countries, among them most European ones.
But in North America and in the Middle East, different conventions are used. Often Sunday is considered the first day of the week. And Jan 1st is in some countries always part of week 1. As a consequence, the first and last week of the year are often fractional.
The QlikView week functions all use ISO 8601. If you want to define these entities in a different way, do the following: Introduce two variables that define your new week system:
Set vFirstWeekdayOfWeek = 6 ; // 0=Mon, 1=Tue, 2=Wed, ... , 6=Sun. (For the U.S. = 6)
Set vMinDaysInWeek = 1; // Minimal number of days in week no 1. (For the U.S. = 1)Then you can define your week fields as:
Load *,
Dual(WeekDay(Date),Mod(WeekDay(Date-$(vFirstWeekdayOfWeek)),7)) as WeekDay,
Ceil((Date-FirstDateOfWeekOne+1)/7) as WeekNumber,
Date(WeekStart(Date-$(vFirstWeekdayOfWeek))+$(vFirstWeekdayOfWeek)) as WeekStart;
Load *,
Date(
WeekStart(YearStart(Date)+$(vMinDaysInWeek)-$(vFirstWeekdayOfWeek)-1)
+$(vFirstWeekdayOfWeek)) as FirstDateOfWeekOne, …Bottom line: Define fields for week day and week number in your master calendar. And don't hesitate to change the environment variables if you want long day names or different day names.
Further reading related to this topic:
-
QlikView 11 Dimension Limit Functionality
One of the common business requirements when analyzing the data is limiting the dimension values on a chart. For instance, limiting the chart to the t... Show MoreOne of the common business requirements when analyzing the data is limiting the dimension values on a chart. For instance, limiting the chart to the top 10 sales people, or showing only the products that make up 80% of sales. QlikView 11 dimension limits functionality enables the business users to easily create these logics on the charts.
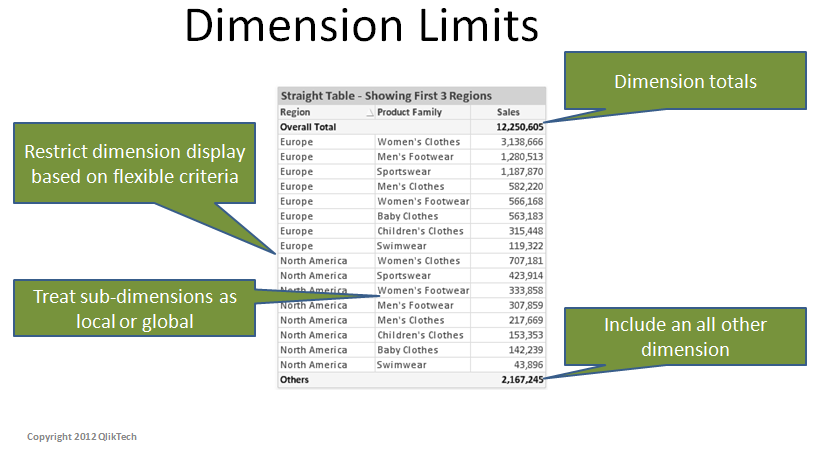
This functionality provides consistency across QlikView charts and more importantly better performance. Prior to QlikView 11, some charts in QlikView could display totals at the expression level, some can limit the number of dimension values to display and some can display an ‘OTHERS’ dimension value to catch those values omitted by the limits. With QlikView 11 dimension limits feature, these functionalities are consistent across chart types. Also, the conditions that are used on the dimension limits are calculated at the engine level, providing better performance and calculation time.
The functionality offers four main options:
- Limits: This option restricts the dimension values displayed on a chart based on flexible criteria. The criteria are evaluated with the first expression of the chart. It is possible to restrict the dimension values by the largest, smallest, first, greater than or less than an exact value or relative the total.
- Global Grouping Mode: With this option, it is possible to treat the dimension values as either ‘local’ to the current upper dimension level in the chart, or ‘global’ to be evaluated across all instance of the upper level dimensions. This option is only applicable to the second or lower level dimensions on a chart.
- Show Total: This option enables the display of subtotals at the dimension levels.
- Show Others: This option displays an ‘OTHERS’ dimension value to catch those values omitted by the limits.
Each option has a separate set of applications and can be used in different permutations.
QlikView 11 dimension limits functionality makes it easier for the business users to customize the QlikView apps based on their own analysis needs with just a few clicks!
-
End of Support for version 9 - 31 October 2012
Hi everyone,This is a reminder that support for version 9 ends on 31 October 2012.For customers who wish to extend support for version 9, please see ... Show MoreHi everyone,
This is a reminder that support for version 9 ends on 31 October 2012.
For customers who wish to extend support for version 9, please see Extended Update Support information in the QlikView Support brochure http://www.qlik.com/us/~/media/Files/resource-library/global-us/direct/datasheets/DS-QlikView-Support-Services-Brochure-EN.ashx
Extended Update Support is a paid for support extension, the cost of which can be found in the pricing page on our web site : http://www.qlik.com/us/explore/pricing.
Version 11 Service Release 2 is now available on our download site.
regards,
Global Support
-
Dashboard 101 - Creating a dashboard
If I say the word “Dashboard”, most readers probably think of a software tool that gives an overview of enterprise health, rather than of a control pa... Show MoreIf I say the word “Dashboard”, most readers probably think of a software tool that gives an overview of enterprise health, rather than of a control panel in front of the driver in a vehicle. One is in a computer, and the other is in a car, but they should play the same role; it should alert you when something is wrong. So where do we start when creating a dashboard for business users?
I follow a D-A-R concept: dashboard-analysis-report. The first QlikView tab, the dashboard, tells users what is good or bad. It’s the “what” sheet. The next batch of tabs is for analysis and has graphs and tables which tell users “how” or “why” things are good or bad. The last part, the report sheet, has more detailed information such as invoice details, order details, employees’ shifts and so on where users can identify the exact action item to act on. So when creating a dashboard, it’s important to highlight the “what” in it.
The first step is to identify the key metrics. The fewer the better. Don’t place 50 KPI’s to try to characterize the entire company in a dashboard, but rather the major ones that matter the most. Pick metrics that change every day if the dashboard is to be utilized daily.
Secondly, make sure all KPI’s have a comparison. Human beings are trained to compare everything 24/7. If your sales figure is 3 million dollars, then so what? Is it better than yesterday’s number? You need to place a comparison number to indicate whether it is better or worse.
Next, don’t use the color green when something is good. If you have 4 KPI’s (key performance indicators) and two of them are green and the other two are red, then people take it as 50% good, not 50% bad. You want users to focus on the ‘bad’ part so they can act on it. Only color-code what is bad, that is, red.
Compare with a dashboard in a car. It does not alert you when something is doing well, but it is designed to alert you on the bad things. Think about the fuel light. It’s not lit in green when your car has enough fuel. Instead it alerts you when fuel is critically low. Then it comes on in red and you notice it right away. It grabs your attention and personally I even get nervous when I see it.
Think about a usage of gauges. A big number with a small red color indicator will do a better job to alert users than a round gauge with both green and red in it.
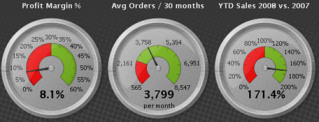
Bottom line: When designing a dashboard, make sure to keep it as simple as possible. When a user looks at it for 10 seconds and looks away, she or he should remember what was bad. Otherwise, it is not playing its fundamental role and is just pretty to look at.
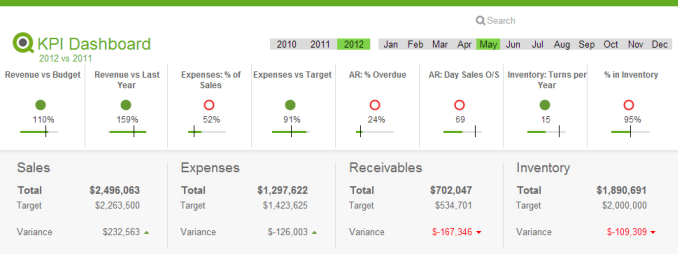
Executive Dashboard on demo.qlik.com.
Here is a technical brief on this topic.
-
Version 11 Service Release 2 is now available - 11.00.11414
Hi everyone,We are pleased to confirm that Version 11 Service Release 2 is now available on http://www.qlik.com/download.Service Release 2 contains th... Show MoreHi everyone,
We are pleased to confirm that Version 11 Service Release 2 is now available on http://www.qlik.com/download.
Service Release 2 contains the new QlikView Offline Capability [see page 20 in the release notes], 6 Design Corrections and over 200 bug fixes.
Please make sure you read the release notes before upgrading to this Service Release. Thank you to all the customers and partners who participated in beta testing Service Release 2.
kind regards
Global Support Team
-
Maps and Mazes: A Tale of Two Extensions
The highly respected (fictional) scientist, Ian Malcolm, once chastised a group of scientists for being “so preoccupied with whether or not they could... Show MoreThe highly respected (fictional) scientist, Ian Malcolm, once chastised a group of scientists for being “so preoccupied with whether or not they could that they didn't stop to think if they should.” Ignoring the fact that this statement was made in regard to ferocious dinosaurs that would soon terrorize mankind, there is truth held within for how we approach technology.
In this business we’ve all been guilty at one time or another of using the “more is more” approach in data visualization. All too often we marvel at something that dazzles without stepping back for a minute to consider the story that’s actually being told by the data. This is especially true with QlikView extensions.
There are a plethora of JavaScript libraries that display data in exciting and dynamic ways. It flies here and there, spins, zooms, explodes, and distracts attention for a bit before the viewer attempts to decipher the information loosely assembled in the chaos. With extensions we sometimes jump at the opportunity to cram a hot, buzzy technology into QlikView simply for the bragging rights. Sometimes what is needed is something much simpler.
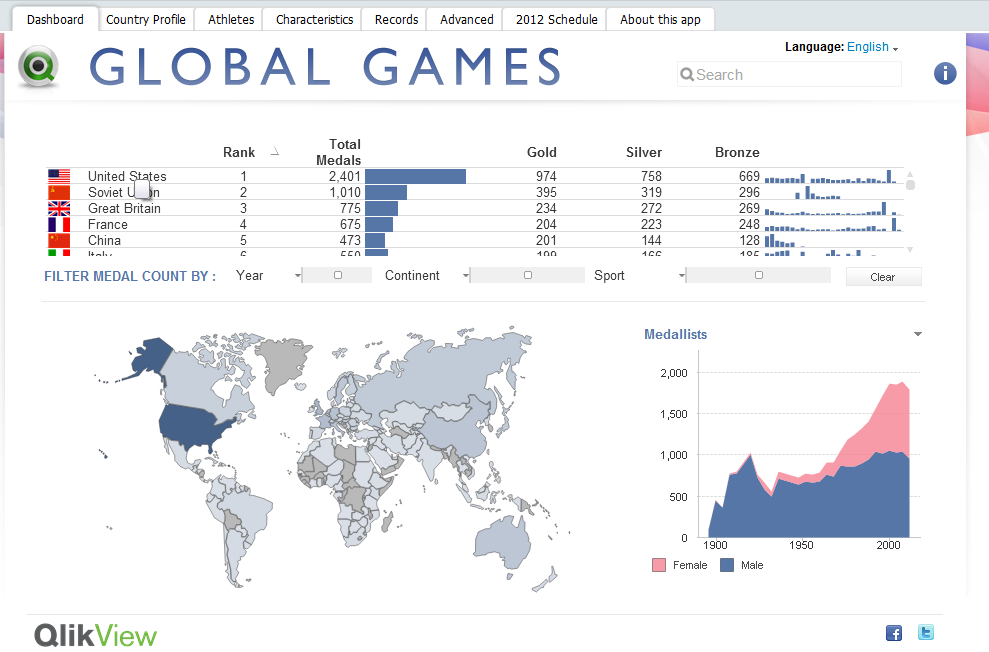 When I began working on an extension to visualize medal counts for the Olympic Games this past summer, it was assumed that I would use a slick mapping UI similar to Google Maps or OpenLayers. These powerful mapping tools allow developers to perform a wide variety of complex geospatial tasks, taking into account curvature of the earth, map projections, tessellation, and a variety of other things that will induce sleep in the average human being.
In order to achieve the effect of highlighting and coloring the different countries for this extension, it is not as simple as telling the Google Maps API to select country X and highlight it with color Y. These mapping tools do not have country or region boundaries prepackaged. Due to this fact, the actual longitude and latitude points for the boundaries of each and every country would need to be found and plotted as shapes on the map. Not only is this a LOT of data for JavaScript to handle, geographical data is not easy to come by.
So, let’s take a step back. The question that needs to be asked is how much additional detail will users need? The data we’re looking to visualize is not geographic in a technical sense. We only need to display the countries of the world as concepts and entities, not as precise geographic objects. In this case, the precision offered by the mapping tool is completely irrelevant, as is the map itself beneath the plotted shapes. Why repurpose a complex and powerful mapping tool to draw a picture? Instead, why don’t we just, you know, DRAW A PICTURE?
Fine, but how do we do that? Enter SVG. SVG (or Scalable Vector Graphics) is a form of vector imagery in XML format which draws shapes and lines as a series of paths. While this format is not supported by all browsers (ahem…Internet Explorer), fortunately there is a JavaScript library called Raphaël that will draw SVG paths in old and new browsers. Finding an SVG of the countries of the world was relatively easy, and from that point, I leveraged Raphaël in drawing the image.
Rather than explain further in great detail how I coded and created this extension, what’s more important is to emphasize the need to consider the goals of our data visualizations. Just because we’re showing a map, must we use a mapping tool? Clearly not, and by drawing the world map as SVG, we used the appropriate tool. Our visualizations should yield to the data. If the data is trying to tell a story, we should get out of the way and let it tell its tale.
For a more in depth and technical overview of the extension, please click here for a zip file containing the extension and a technical brief.


