Unlock a world of possibilities! Login now and discover the exclusive benefits awaiting you.
Product Innovation
By reading the Product Innovation blog, you will learn about what's new across all of the products in our growing Qlik product portfolio.
Support Updates
The Support Updates blog delivers important and useful Qlik Support information about end-of-product support, new service releases, and general support topics.
Qlik Academic Program
This blog was created for professors and students using Qlik within academia.
Community News
Hear it from your Community Managers! The Community News blog provides updates about the Qlik Community Platform and other news and important announcements.
Qlik Digest
The Qlik Digest is your essential monthly low-down of the need-to-know product updates, events, and resources from Qlik.
Qlik Learning
The Qlik Learning blog offers information about the latest updates to our courses and programs, as well as insights from the Qlik Learning team.
Recent Blog Posts
-
-
Synthetic Keys
In a well visited post on the community forum, John Witherspoon some time ago asked “Should We Stop Worrying and Love the Synthetic Key?” John’s post begins: “Synthetic keys have a bad reputation. The consensus seems to be that they cause performance and memory problems, and should usually or even always be removed. I believe that the consensus is wrong.” Here’s my view on this topic.The creation of synthetic keys is simply QlikView’s way of mana... Show MoreIn a well visited post on the community forum, John Witherspoon some time ago asked “Should We Stop Worrying and Love the Synthetic Key?” John’s post begins: “Synthetic keys have a bad reputation. The consensus seems to be that they cause performance and memory problems, and should usually or even always be removed. I believe that the consensus is wrong.” Here’s my view on this topic.
The creation of synthetic keys is simply QlikView’s way of managing composite keys. There is nothing strange or magic around it.
A single key is easy to manage: Just list all unique values in a symbol table (see Symbol Tables and Bit-Stuffed Pointers), and then link the data tables using a natural join.
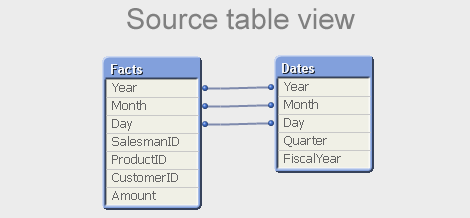
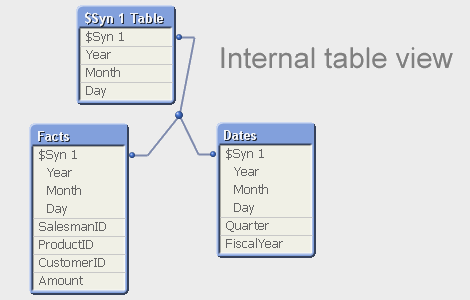
But a composite key is slightly different – there is no single symbol table that contains the relevant combinations of the multiple key fields. So QlikView needs to create such a table for all combinations: the $Syn table. In a way, you can say that the $Syn table is a symbol table for composite keys. In the data tables, the multiple keys are replaced by an identifier that uniquely identifies the combination of the values of the original keys: the $Syn key.
Hence, if you have the same set of multiple keys in two or more tables, the QlikView synthetic keys create a general, correct, compact and efficient solution. Synthetic keys do not per se cause performance and memory problems. They do not use a lot more memory than if you autonumber your own concatenated key. And they treat NULLs correctly, as opposed to an explicit concatenated key.
Hence: The synthetic key is in itself good and we should all love it.
However… still, also I avoid synthetic keys. Why?
- A synthetic key is in my experience often a sign of a poorly designed data model. I say that, given the number of times I have found a synthetic key in the table viewer only to realize that I made a mistake in the script. If you get a synthetic key and didn’t expect it, I can only say: Back to the drawing board! You should most likely change your data model.
- QlikView creates an additional table (the $Syn table) that in many cases is superfluous: An additional table is the best solution if none of the data tables by itself completely spans the set of composite keys. But in real life, there is usually one table that contains all relevant combinations of the keys, and then this table can be used to store the clear text of the individual keys.
- For clarity, I like to create my own concatenated keys. It forces me to think and create a data model that I believe in. Removing the synthetic keys becomes a method to ensure a good data model, rather than a goal in itself.
But in principle, I totally agree with John’s initial conclusion: Any problem around synthetic keys is really a data modeling problem and not a problem with the synthetic key itself.
The short answer to John’s question is Yes and No. Yes, we should love the synthetic key. But, No, we should not stop worrying. We should always be alert and ask ourselves: “Do I want this synthetic key? Is the data model OK?”
And so, because of the automated and irrevocable data-modeling process which rules out human meddling, the Synthetic Keys are scaring. But they are simple to understand. And completely credible and convincing.
Dr HIC
Further reading on Qlik data modelling:

-
Introducing our new Ideation area + other enhancements!
Read more about our enhancements for the month of June. -
Interacting with data using Enigma.js PT 3: Evaluate & Monitor Master Measures
In my previous blog posts (part 1, part 2), I explained how we can use enigma.js to communicate with the Qlik Associative Engine and get access to data. We also went through the concept of Generic Objects and saw how they can be used to do many things including getting raw data and using it to build visualizations. In this post, we are going to expand on that and take a look at a real world example where enigma.js can be used to get Master Measur... Show MoreIn my previous blog posts (part 1, part 2), I explained how we can use enigma.js to communicate with the Qlik Associative Engine and get access to data. We also went through the concept of Generic Objects and saw how they can be used to do many things including getting raw data and using it to build visualizations.
In this post, we are going to expand on that and take a look at a real world example where enigma.js can be used to get Master Measures data that is rendered as KPIs in a web app, and monitor them for any changes to reflect the latest values.
This post is based on the following tutorial on qlik.dev where you can find the boilerplate code and more resources to help you get started: https://qlik.dev/embed/control-the-experience/dimensions-and-measures/get-master-measures/
You will find the full example code attached at the end of the post, I recommend you download it and open it in your favorite text editor as I will only feature some parts of it to keep this post short.
1- First, let’s take a look at the index.html:
- We include the enigma.js library.
- We define the configuration options to connect to our Qlik Cloud tenant and other needed variables including:
- the tenant URL
- the Web Integration ID (you can learn more about how to create this here)
- The App ID
- and a list containing the names of the Master Measures we wish to access.
const TENANT = '<INSERT YOUR TENANT HERE (example: xxxx.us.qlikcloud.com)>'; const WEB_INTEGRATION_ID = '<INSERT WEB INTEGRATION ID HERE>'; const APP_ID = '<INSERT APP ID HERE>'; const MASTER_MEASURE_NAMES = ['# of Invoices', 'Average Sales per Invoice', 'Sales (LYTD)', 'Sales LY']; const IDENTITY = '1234';- In the main function, we initiate the login process, get the csrf token, and open the Enigma session. Then we get all the Master Measures via the getMeasureList function, and render only the Master Measure data from the "MASTER_MEASURE_NAMES" list we previously defined.
- All the functions are defined in scripts.js
(async function main() {
    const isLoggedIn = await qlikLogin();
    const qcsHeaders = await getQCSHeaders();
    const [session, enigmaApp] = await getEnigmaSessionAndApp(qcsHeaders, APP_ID, IDENTITY);

    handleDisconnect(session);

    const allMasterMeasuresList = await getMeasureList(enigmaApp);
    const masterMeasureValuesDct = await masterMeasureHypercubeValues(enigmaApp, allMasterMeasuresList, MASTER_MEASURE_NAMES);
})();
2- Now, let’s take a look at the different functions that make this happen:
- Login and session handling:
- the qlikLogin function checks to see if you are login by fetching the /api/v1/users/me api endpoint, if not it redirects to the Interactive idp login page.
- getQCSHeaders fetches the CSRF token needed to make the websocket connection to the Qlik Engine.
// LOGIN async function qlikLogin() { const loggedIn = await fetch(`https://${TENANT}/api/v1/users/me`, { mode: 'cors', credentials: 'include', headers: { 'qlik-web-integration-id': WEB_INTEGRATION_ID, }, }) if (loggedIn.status !== 200) { if (sessionStorage.getItem('tryQlikAuth') === null) { sessionStorage.setItem('tryQlikAuth', 1); window.location = `https://${TENANT}/login?qlik-web-integration-id=${WEB_INTEGRATION_ID}&returnto=${location.href}`; return await new Promise(resolve => setTimeout(resolve, 10000)); // prevents further code execution } else { sessionStorage.removeItem('tryQlikAuth'); const message = 'Third-party cookies are not enabled in your browser settings and/or browser mode.'; alert(message); throw new Error(message); } } sessionStorage.removeItem('tryQlikAuth'); console.log('Logged in!'); return true; } // QCS HEADERS async function getQCSHeaders() { const response = await fetch(`https://${TENANT}/api/v1/csrf-token`, { mode: 'cors', credentials: 'include', headers: { 'qlik-web-integration-id': WEB_INTEGRATION_ID }, }) const csrfToken = new Map(response.headers).get('qlik-csrf-token'); return { 'qlik-web-integration-id': WEB_INTEGRATION_ID, 'qlik-csrf-token': csrfToken, }; }- Enigma session connection:
- we use enigma.create() function to establish the websocket connection and create a new QIX session.
- we use openDoc() method of the global object to open our app, and then return it for later use.
// ENIGMA ENGINE CONNECTION async function getEnigmaSessionAndApp(qcsHeaders, appId, identity) { const params = Object.keys(qcsHeaders) .map((key) => `${key}=${qcsHeaders[key]}`) .join('&'); return (async () => { const schema = await (await fetch('https://unpkg.com/enigma.js@2.7.0/schemas/12.612.0.json')).json(); try { return await createEnigmaAppSession(schema, appId, identity, params); } catch { const waitSecond = await new Promise(resolve => setTimeout(resolve, 1500)); try { return await createEnigmaAppSession(schema, appId, identity, params); } catch (e) { throw new Error(e); } } })(); } async function createEnigmaAppSession(schema, appId, identity, params) { const session = enigma.create({ schema, url: `wss://${TENANT}/app/${appId}/identity/${identity}?${params}` }); const enigmaGlobal = await session.open(); const enigmaApp = await enigmaGlobal.openDoc(appId); return [session, enigmaApp]; }- Get a list of all master measures in our app:
Now that we have the enigma app object, we can use the createSessionObject method to create a session object by passing the qMeasureListDef definition with qType “measure”
// GET LIST OF ALL MASTER MEASURES async function getMeasureList(enigmaApp) { const measureListProp = { "qInfo": { "qType": "MeasureList", "qId": "" }, "qMeasureListDef": { "qType": "measure", "qData": { "title": "/qMetaDef/title", "tags": "/qMetaDef/tags" } } } const measureListObj = await enigmaApp.createSessionObject(measureListProp); const measureList = await measureListObj.getLayout(); return measureList.qMeasureList.qItems; }- Get data from our list of Master Measures:
- Now, we loop through the list of all master measures returned from the function above and only grab the ones matching our list of matching measures from the MASTER_MEASURE_NAMES variable defined in index.html.
- We then create a generic object based on the Hypercube definition that includes the matchingMeasures representing the measureObjects’ qIds.
- Finally, we listen to any changes using the .on(”changed” …) event listener and grab the latest layout.
// CREATE HYPERCUBE WITH MULTIPLE MASTER MEASURES (INCLUDE MATCHING NAMES ONLY) async function masterMeasureHypercubeValues(enigmaApp, allMasterMeasuresList, desiredMasterMeasureNamesList) { let matchingMeasures = []; allMasterMeasuresList.forEach(measureObject => { if (desiredMasterMeasureNamesList.includes(measureObject.qMeta.title)) { matchingMeasures.push({ "qLibraryId": measureObject.qInfo.qId }) } }); if (!matchingMeasures.length > 0) { console.log('No matching master measures found! Exiting...'); return } const measureDef = { "qInfo": { "qType": 'hypercube', }, "qHyperCubeDef": { "qDimensions": [], "qMeasures": matchingMeasures, "qInitialDataFetch": [ { "qHeight": 1, "qWidth": matchingMeasures.length, }, ], }, }; const measureObj = await enigmaApp.createSessionObject(measureDef); const measureObjHypercube = (await measureObj.getLayout()).qHyperCube; // LISTEN FOR CHANGES AND GET UPDATED LAYOUT measureObj.on('changed', async () => { const measureObjHypercube = (await measureObj.getLayout()).qHyperCube; processAndPlotMeasureHypercube(measureObjHypercube); }) processAndPlotMeasureHypercube(measureObjHypercube); }- Render the data to the HTML as KPIs:
Lastly, we retrieve the data in “hypercube.qDataPages[0].qMatrix” and loop through it to construct an easy manipulate array of key/value objects which are then injected into the HTML.
//    HELPER FUNCTION TO PROCESS HYPERCUBE INTO USER FRIENDLY DICTIONARY
function processAndPlotMeasureHypercube(hypercube) {

    const masterMeasureValuesDict = Object.create(null);

    hypercube.qMeasureInfo.forEach((measure, i) => {
        masterMeasureValuesDict[measure.qFallbackTitle] = hypercube.qDataPages[0].qMatrix[0][i].qText;
    });

    const masterMeasureKeys = Object.keys(masterMeasureValuesDict);
    masterMeasureKeys.sort();

    const sortedMasterMeasureValuesDict = Object.create(null);
    masterMeasureKeys.forEach(name => {
        sortedMasterMeasureValuesDict[name] = masterMeasureValuesDict[name];
    })

    renderKpis(sortedMasterMeasureValuesDict);
}


// RENDER KPIs
function renderKpis(masterMeasureValuesDict) {

    let kpiData = [];
    Object.entries(masterMeasureValuesDict).forEach(([key, value]) => {
        kpiData.push({
            label: key,
            value: Number(value).toLocaleString()
        });
    });

    const kpisContainer = document.querySelector('#kpis');
    kpisContainer.innerHTML = '';

    kpiData.forEach((kpi) => {
        const kpiCard = document.createElement('div');
        kpiCard.classList.add('kpi-card');

        const labelElement = document.createElement('div');
        labelElement.classList.add('kpi-label');
        labelElement.innerText = kpi.label;

        const valueElement = document.createElement('div');
        valueElement.classList.add('kpi-value');
        valueElement.innerText = kpi.value;

        kpiCard.appendChild(labelElement);
        kpiCard.appendChild(valueElement);

        kpisContainer.appendChild(kpiCard);
    });
}
This is how the KPIs are rendered to the page:To show how the on-change event listener works, let's simulate a change by editing the # of Invoices Master Measure in Qlik:
Looking back the web page, the change is instantly reflected on the KPI:
That’s all, I hope you found this post helpful, do not forget to check out more tutorials on qlik.dev that cover other important use cases!
P.S: to make it easier to run the web app, I have included a server.py file to easily serve the files via https://localhost:8000. You can run it with the command: python server.py.
Also, don’t forget to whitelist this localhost domain when generating a new Web Integration ID:
Thanks for reading!
-
Qlik Sense Qualification Exams - 2023 Update
Qlik Education is pleased to announce the Business Analyst and Data Architect Qualification Exams have been updated and are based on the SaaS editions* of Qlik Sense. However, you may also use Qlik Sense on Windows editions. -
Qlik Data Gateway -Direct Access, now supports SAP Connectivity
Qlik Data Gateway - Direct Access now supports SAP SQL and SAP BW connectors, providing an encrypted connection to Qlik Cloud via Data Gateway. This enables Qlik Sense SaaS applications in Qlik Cloud to securely access and analyze SAP SQL and SAP BW data that resides behind your organization's firewall, without compromising your enterprises' network security. -
Win $100 Amazon Gift Card for 7 minutes of your time!
The Qlik Education Team wants to know more about your learning experience with the Qlik Continuous Classroom and your learning preferences - Thank you to all who participated - Winners Selected!
-
You Asked, We Answered!
We have compiled a list of your most frequently asked questions for the Qlik Learning Portal and answered them for you on this blog post.
-
Automated Insights through Insight Advisor in Qlik Sense - part of the fully Int...
Welcome to this ongoing video series focused on our strategy, capabilities and direction for AI and ML. During this series, we describe our unique approach to AI and ML, demonstrate existing and new capabilities for Augmented Analytics in Qlik Sense, AutoML, and Predictive Analytics, and offer a look at our future direction and what’s coming next. In this second video, we cover Automated Insights and natural language interaction through Insight ... Show MoreWelcome to this ongoing video series focused on our strategy, capabilities and direction for AI and ML. During this series, we describe our unique approach to AI and ML, demonstrate existing and new capabilities for Augmented Analytics in Qlik Sense, AutoML, and Predictive Analytics, and offer a look at our future direction and what’s coming next.
In this second video, we cover Automated Insights and natural language interaction through Insight Advisor in Qlik Sense.
-
Qlik Digest - June 2023
Welcome to the June Qlik Digest! Of course, the big news is that we have officially joined forces with Talend, after the acquisition closed on May 16. In this edition, discover how our combined strengths can transform your business with our live demo. Also, meet our shiny new chat bot, saving you time with instant assistance. -
Computing Degrees Increasing in Popularity
Interest in computing degrees is growing faster than any other subject in the UK in 2023. -
Natural Language API Now Available for Developers in Qlik Sense
Conversational analytics is the new form of self-service where technical ninja-skills are no longer required to derive insights from complex data sets. Now with the emergence of conversational analytics and Natural Language processing engines like Qlik’s Insight Advisor Chat, users of all levels can interact with data naturally by asking questions in their own words and receiving answers and chart suggestions instantly. -
Connector Factory – May 2023 releases
Connector Factory is Qlik’s strategy to continually expand access to and delivery of data from hundreds of SaaS applications and data sources to fuel ever-evolving enterprise cloud analytics and data integration needs. In the past few weeks, Connector Factory has released the following Qlik Cloud Analytics and Qlik Application Automation connectors. -
Tips and Tricks: Creating a Multi-layer Drilldown Map with different layer types
Customer asked how to create a drill-able map, BUT wanted to display different layers when drilling down. It's very easy by simply using a Drilldown dimension and controlling the layer visibility in the map layer options - check it out!
-
Unbalanced, n-level hierarchies
Hierarchies are very common in all database and business intelligence solutions. Usually they are balanced and with a fix number of levels, and then they do not pose any problems. Just load the data, add a drill-down group, and you’re done. But there is one type of hierarchy that is somewhat tricky to get right – an unbalanced, n-level hierarchy. Typical for this type of hierarchy is that the levels are not named, and you really don’t know on wh... Show MoreHierarchies are very common in all database and business intelligence solutions. Usually they are balanced and with a fix number of levels, and then they do not pose any problems. Just load the data, add a drill-down group, and you’re done.
But there is one type of hierarchy that is somewhat tricky to get right – an unbalanced, n-level hierarchy. Typical for this type of hierarchy is that the levels are not named, and you really don’t know on which level you need to search for a specific node.
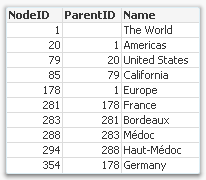
Usually such a hierarchy is stored in an Adjacent Nodes table, i.e. a table that has one record per node and each node has a reference to its parent.
Such a table can be loaded into QlikView directly using the Hierarchy prefix. This prefix will transform the Adjacent Nodes table into an Expanded Nodes table that has additional fields that you can use in your app.
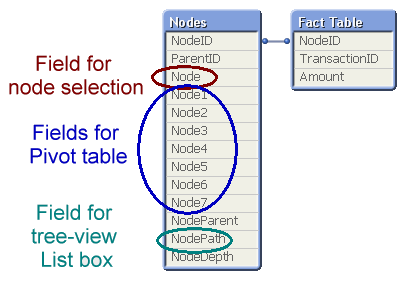
With the fields in this table, you can easily create a pivot table and a tree-view list box. Below you can see some wine districts displayed in both these object types:
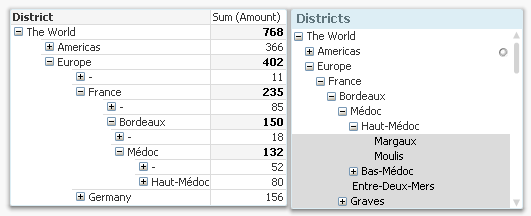
One challenge with hierarchies is that you can refer to a node in two different ways: Either to the node including the entire sub-tree, or to the node only, excluding all sub-nodes. In the example with the wine districts, it would mean any wine from Bordeaux, and unspecified Bordeaux, respectively. In the pivot table above, the difference is obvious: Any wine from Bordeaux sums up to 150 units, and the unspecified Bordeaux sums up to 18 units.
A user usually wants to make selections referring to the entire sub-tree, but the above solution does not have any field for this. To create such a field, you need the second hierarchy-resolving prefix – the HierarchyBelongsTo.
This prefix will also transform the hierarchy table. The result will be a table containing one record per descendant-ancestor pair. In other words, the ancestor (tree ID) will link to all its descendants (node ID), and can thus be used to make selections of entire sub-trees. (The “TreeBridge” table in the picture below.)
But it doesn’t stop here… The above solution creates one field in which tree searches can be made, but in order to create a drill-down for trees, you need an additional table – an expanded nodes table for the trees. This can be created with a second Hierarchy statement, but now one that links to the tree ID instead of the node ID. (The “Trees” table in the picture below.)
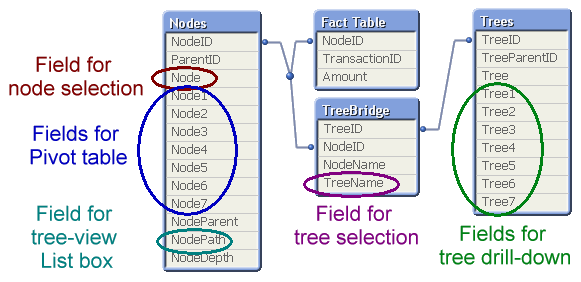
The data model with the three hierarchy tables is the one I recommend: It generates all fields you need.
A more elaborate explanation with script examples can be found in the technical brief about Hierarchies.
Further reading related to this topic:
-
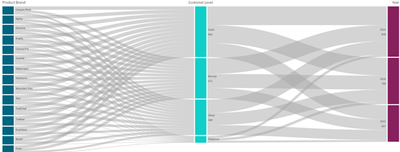
Sankey Charts: Contribution and Distribution
A explaination of Sankey charts and how you can best use them in Qlik. -
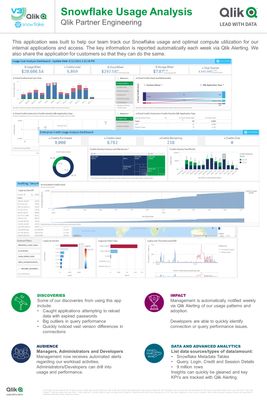
Snowflake Usage Analysis
Download the latest and greatest version of the application from GitHub here: https://github.com/Qlik-PE/Snowflake-Usage-Analysis-Dashboard -
Calling All APAC Data Lovers!
Register for Applied Data Analytics using Qlik Sense Course starting June 19 in APAC.
-
【オンデマンド配信】QlikWorld 2023 ダイジェスト Web セミナー
今年 4月、毎年恒例の最大級のデータイベント「QlikWorld 2023」が、米国ラスベガスで開催されました。特別ゲストおよび Qlik エグゼクティブによる基調講演をはじめ、100 以上のセッションや実践的なワークショップ、グローバルトランスフォーメーションアワード授与式など、データ愛好家が一堂に会した 4 日間は、連日盛況のうちに終了しました。本 Web セミナーでは、Qlik の日本の営業および技術者が、QlikWorld 2023 でご紹介した内容をわかりやすくまとめてお届けします。Qlik のビジョンや製品ポートフォリオ、最新のユーザー事例、Qlik で先進的なビジネス成果を挙げている企業に授与されるグローバルトランスフォーメーションアワードのほか、実際に参加した営業担当者が現地でのイベントの様子をご紹介します。ぜひ、データ活用のすべてを網羅した「QlikWorld 2023」をダイジェストでご視聴ください。 ※ 参加費無料。パソコン・タブレット・スマートフォンで、どこから... Show More今年 4月、毎年恒例の最大級のデータイベント「QlikWorld 2023」が、米国ラスベガスで開催されました。
特別ゲストおよび Qlik エグゼクティブによる基調講演をはじめ、100 以上のセッションや実践的なワークショップ、グローバルトランスフォーメーションアワード授与式など、データ愛好家が一堂に会した 4 日間は、連日盛況のうちに終了しました。
本 Web セミナーでは、Qlik の日本の営業および技術者が、QlikWorld 2023 でご紹介した内容をわかりやすくまとめてお届けします。Qlik のビジョンや製品ポートフォリオ、最新のユーザー事例、Qlik で先進的なビジネス成果を挙げている企業に授与されるグローバルトランスフォーメーションアワードのほか、実際に参加した営業担当者が現地でのイベントの様子をご紹介します。ぜひ、データ活用のすべてを網羅した「QlikWorld 2023」をダイジェストでご視聴ください。※ 参加費無料。パソコン・タブレット・スマートフォンで、どこからでもご視聴いただけます。日本語字幕付きでお届けします。
-
2022 FIFA World Cup Teams
2022 FIFA World Cup Teams AnyChart — QS Extensions Explore Qatar 2022 teams by league and club with remarkable Decomposition Trees. Discoveries Investigate how the national football/soccer teams of all 32 participating countries in the 2022 Qatar World Cup are made up of players from various leagues and clubs, using remarkable Decomposition Tree visualizations in Qlik Sense. (Re)arrange the order of the represented dimensions dependin... Show More2022 FIFA World Cup TeamsAnyChart — QS Extensions Explore Qatar 2022 teams by league and club with remarkable Decomposition Trees.
Discoveries
Investigate how the national football/soccer teams of all 32 participating countries in the 2022 Qatar World Cup are made up of players from various leagues and clubs, using remarkable Decomposition Tree visualizations in Qlik Sense. (Re)arrange the order of the represented dimensions depending on how you want to disaggregate the totals. Analyze goals and caps for national teams similarly using intuitive decomposition trees.
Impact
Check out how AnyChart's Decomposition Tree works and how it can help you explore data across multiple dimensions.
Audience
Anyone who wants to analyze the 2022 Qatar World Cup's teams and see an example of a decomposition tree in Qlik Sense in action.
Data and advanced analytics
This application features decomposition trees built with AnyChart's Decomposition Tree extension for Qlik Sense.
🔗 >> VIEW IT LIVE OR DOWNLOAD (.QVF) <<