Unlock a world of possibilities! Login now and discover the exclusive benefits awaiting you.
Analytics & AI
Forums for Qlik Analytic solutions. Ask questions, join discussions, find solutions, and access documentation and resources.
Data Integration & Quality
Forums for Qlik Data Integration solutions. Ask questions, join discussions, find solutions, and access documentation and resources
Explore Qlik Gallery
Qlik Gallery is meant to encourage Qlikkies everywhere to share their progress – from a first Qlik app – to a favorite Qlik app – and everything in-between.
Qlik Community
Get started on Qlik Community, find How-To documents, and join general non-product related discussions.
Qlik Resources
Direct links to other resources within the Qlik ecosystem. We suggest you bookmark this page.
Qlik Academic Program
Qlik gives qualified university students, educators, and researchers free Qlik software and resources to prepare students for the data-driven workplace.
Recent Blog Posts
-
Qlik | Talend:未来が今ここに(Qlik Blog 翻訳)
ブログ著者:Mike Capone 本ブログは Qlik | Talend: Looking Forward の翻訳になります。 私たちは常に前を向き、最も包括的で信頼できるソリューションをお客様に提供することに重点を置いてきました。このたび、Talend のクラウドデータ統合とデータ品質ソリ... Show Moreブログ著者:Mike Capone 本ブログは Qlik | Talend: Looking Forward の翻訳になります。
私たちは常に前を向き、最も包括的で信頼できるソリューションをお客様に提供することに重点を置いてきました。このたび、Talend のクラウドデータ統合とデータ品質ソリューションにより、さらに多くのことを提供できるようになりました。Talend の買収と、イノベーションと研究開発への継続的なコミットメントにより、Qlik はデータ統合、データ品質、アナリティクスのリーダーとなります。
私たちの業界には、市場を一変するような素晴らしい機会があります。一方で、企業のCIO が周囲を見渡した時に、選択肢が十分ではないという現実があります。
- 大きな頭痛の種となる(しかも実績の少ない)複数の単体製品
- 現在のニーズ(あるいは将来のニーズ)を満たさない不完全なレガシー製品
- ベンダーロックインを引き起こすハイパースケーラー(それが彼らのビジネスモデルです)
今日、私は新しいアプローチを発表できることを誇りに思います。最新で、実績があり、信頼できる、そしてオープンでクラウドの種類にとらわれないクラス最高のソリューションの広範なソリューションセットです。つまり、Qlik と Talend が一緒になることで、お客様は技術的負債とコストを排除し、信頼できるデータが最も重要な時に意思決定に利用できるという確信を高めることができるようになるのです。
さらに、Qlik と Talend の両社には輝かしい歴史があります。複数の市場カテゴリーで主要なソリューションプロバイダーとしての地位を獲得したことを光栄に思うとともに、今後もお客様の既存投資をサポートすることに全力を尽くします。ガートナーは、Talend を 7年連続でデータ統合ツールのマジック・クアドラントのリーダーに、5年連続でデータ品質ソリューションのマジック・クアドラントのリーダーに位置付けています。また、Qlik は 13年連続でマジック・クアドラントのアナリティクスおよびビジネス・インテリジェンス・プラットフォーム部門でリーダーに選ばれています。さらに、「IDC MarketScape:U.S. Business Intelligence and Analytics Platforms 2022 Vendor Assessment」においてもリーダーに選ばれています。
私の前職は CIO でしたがその際は、信頼できる少数のパートナーとソリューションを構築し、望む成果のために投資していました。そして私たちは Qlik をそういう会社として築いてきました。今日、私たちは世界中のパートナーエコシステムとともに未来に目を向け、業界最高のデータ統合、データ品質、アナリティクス、AI、機械学習ソリューションを提供いたします。
Talend チームを Qlik に迎え、皆様に「未来」をお見せするのがとても楽しみです。
統合されたポートフォリオの詳細についてはウェビナー「 Qlik | Talend: What's Next is Now」をご視聴ください。
-
Expand your Qlik Data Integration knowledge
Choose from over 50 Qlik Data Integration self-paced learning modules in the Qlik Continuous Classroom. From Qlik Replicate Troubleshooting to Qlik Co... Show MoreChoose from over 50 Qlik Data Integration self-paced learning modules in the Qlik Continuous Classroom.
From Qlik Replicate Troubleshooting to Qlik Compose for Data warehouses, find the course to suit you.
Sort by the Newest First to see the newly added or updated courses:
Don't know where to start? Sort by Course Order in our Course Search page which will provide you the recommended courses to start with:
Start exploring Qlik Data Integration with Using Qlik Cloud Data Integration to Onboard and Transform Data Module.
This module will explore the Data Movement and Transformation processes available in Qlik Cloud Data Integration. With this free module, you will be able to :
- Define Qlik Cloud Data Integration
- Differentiate Data Integration services
- Explore the data onboarding process
- Investigate lightweight data transformations
Happy Learning!

-
Qlik Sense February 2023 Client-Managed Release - Now Available!
Visualizations & Dashboards: Increased Number of Visible Points in Scatter Plot A highly-requested customer feature, the scatter plot now enables ... Show MoreVisualizations & Dashboards:
Increased Number of Visible Points in Scatter Plot
A highly-requested customer feature, the scatter plot now enables the developer to change the threshold for points on display. The maximum was previously 1500 points. The zoom and pan is adjusted automatically for large volumes and selection, tooltip and brushing turns off for larger data point sets.
New Styling Panel
A new Styling Panel has been added to Gauge, Histogram, and Waterfall Charts; plus, Box Plot, Distribution Plot, and KPI objects, providing greater flexibility and customization. Previously the Styling Panel was added to Bar, Pie, Map, Table, and Pivot Charts. Styling covers titles, subtitles, and footnotes, with options for font size, color, and family. Sheet background color and image can now also be added.
Styling Panel for Straight and Pivot Tables
Provides flexibility, allowing customers to conform to company, department, or personal style standards and preferences. Styling covers titles, subtitles, and footnotes, and includes options for font size, color, and family.
Chart Animations
Chart animations are the gradual transitions in a visualization from the old view to the new view when data has been changed, for example, after a selection has been made. Animations can be turned on or off under app settings.
New Sheet Grid and Sheet Background Options
Sheets can now have custom background images and colors, allowing you to divide your sheet into sections, add images from your media library, and much more! On top of that, we’ve also added a finer granular grid to the sheet, allowing for additional control over object placement and sheet grid size to support advanced formatting for presentations.
Augmented Analytics:
Ability to add Natural Language to Sheet as an Object
Qlik Sense now includes a natural language object that can be added directly to dashboards and applications to deliver AI-generated insights. App creators can configure the NLG object to produce narratives for any context by choosing dimensions, measures, and applicable analysis types – delivering insights for the overall context of a sheet, describing a group of visualizations, or creating readouts for individual visualizations. This capability extends our NLG capabilities beyond the Insight Advisor experience, allowing all Qlik Sense users to benefit from narrative interpretations and readouts when exploring in dashboards, boosting data literacy, and driving improved data storytelling.
Connectivity:
Support Views/Lists in Office 365 SharePoint Connector
You can now access data stored in ServiceNow. The new ServiceNow connector allows you to include ServiceNow data, such as incidents, requests, and case records within your analysis. The new connector includes security options such as OAuth or SSL to ensure that only authorized users can access this data.
Change S3 connector to use AWS SDK for .NET Core
Qlik is planning to add more security enhancements to this connector which require the use of AWS SDK. In preparation for these future capabilities, new versions of the Amazon S3 storage and metadata connectors built using AWS SDK for .NET have been released and are called Amazon S3 Connector V2. Note that, for now, the initial release of the S3 Connectors V2 and the existing S3 connectors (which rely on the REST API) will both have the same capabilities. However, new capabilities will only be added to the V2 connectors going forward. It is also anticipated that at some point in the future, the existing S3 Connectors will be depreciated.
DOWNLOAD LATEST VERSION OF QLIK SENSE HERE
Access Release notes: here
-
Filter Pane Customization
There are now many new ways a filter pane can be customized to change its appearance and/or functionality. In this blog, I will cover the new customiz... Show MoreThere are now many new ways a filter pane can be customized to change its appearance and/or functionality. In this blog, I will cover the new customizations available. Let's start with the new look of the filter pane properties panel (shown below). Now when the field or master item is selected in the properties panel, an additional properties panel is provided with further appearance and functionality options.
There is now a “Show title” checkbox that can be used by app developers to show or hide the title of the filter pane. App developers can indicate if they want search capabilities on or off in a filter pane by toggling the Search option. By default, the search mode for a filter pane is normal, but now it can be set to Wildcard mode which adds asterisks before and after the search text like this:
This example wildcard search will search for any text with “wear” in it.
In the presentation section of the properties panel, is where app developers can customize how the filter pane will look. By default, the text alignment is set to Auto, but it can also be set to left, center or right. There are checkboxes for the following options: Compact view, Checkbox mode and Histogram.
The Compact view option reduces the space between dimension values, fitting more items in less space. In the image below, the second filter pane has the Compact view option checked. Notice that there is less space between the list items, making the filter pane smaller than the default filter pane on the far left. This can be helpful if space is an issue on your sheet. The Checkbox mode (see third filter pane) will add a checkbox to the left of the list items and the checkbox is what is used to make selections. The Histogram option (fourth filter pane) displays bars under each list items to indicate the frequency of the item in the data – it is like a visual representation of the frequency. Each of these options can be used independently or in combination with one another. Below is an example of each and all three together.
The last of the new customization options that can be found in the properties pane is how to show the data – either single column or grid.
Here is a simple example using the Year dimension. The filter pane on the left is showing the filter as a grid while the filter pane on the right is showing a single column.
Here is another example of the grid option when there are more values.
When displaying the values in a grid, the app developer is presented with the option to set the order and the maximum number of columns. In the example above the values are ordered by row, so you read them from left to right versus top to bottom. The Max visible columns can be manually set (custom) or can be set to auto.
These new filter pane customization options provide the app developer with more flexibility in how they would like to present filter panes on a sheet. Check out Qlik Help for a video on creating a filter pane as well as additional helpful information. Also take a look at Michael Tarallo’s SaaS in 60 video here for this and other new features in Qlik Sense SaaS.
Thanks,
Jennell
-
Excluding values in Set Analysis
In Set Analysis, it is straightforward to make selections; to define the criteria for inclusion. But it is not as straightforward to define an exclusi... Show MoreIn Set Analysis, it is straightforward to make selections; to define the criteria for inclusion. But it is not as straightforward to define an exclusion. But there are in fact several ways to do this.
First of all, an inclusion can be defined the following way:

This expression is equivalent to saying “Sum the Amounts where Field equals X”.
But if you want to say the opposite – “where field does not equal X” – it becomes more complicated. The relation “not equal to” is not a Set operation. However, one way to do this is to use the implicit exclusion operator:

Note the minus sign in front of the equals sign. This will create an element set based on the existing selected values, but with the value X removed.
A second way to do this is to use the unary exclusion operator:

This will return the complement set of X and use this as element set in the set expression.
In many situations the two methods return identical sets. But there are cases when they are different. In the table below you can see that it makes a difference if there already is a selection in the field.
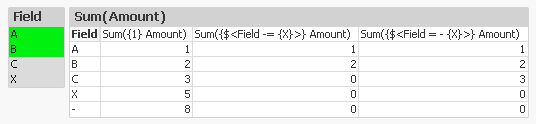
Note the difference on the row with the C. Since the implicit operator (the 2nd expression) is based on current selection, also the value C is excluded from the calculation. This is in contrast to the unary operator (the 3rd expression) that creates a completely new element set, not based on current selection.
We can also see that both of the above expressions exclude records where the field is NULL (the line where Field has a dash only). The reason is simple: As soon as there is a selection in the field, the logical inference will exclude NULL in the same field.
So what should you do if you want to exclude X but not NULL?
The answer is simple: Use another field for your selection. Typically you should use the primary key for the table where you find the Amount.

Here you need to use the element function E(), that returns excluded values. Hence, the above Set expression says: “Select the IDs that get excluded when selecting X.”
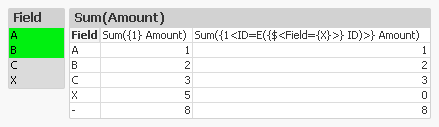
The table confirms that we get the records we want: X is excluded but NULL is still included.
With this, I hope that you understand Set Analysis somewhat better.
Further reading related to this topic:

-
Qlik Cloud Government releases major update with Data Integration, Automations, ...
The following release is significant in terms of capabilities for Qlik Cloud Government as an end-to-end platform built to drive informed action. See ... Show MoreThe following release is significant in terms of capabilities for Qlik Cloud Government as an end-to-end platform built to drive informed action. See below for a quick list of what’s been included within this release and scroll further for more in-depth details of each product.
Recently Released in Qlik Cloud Government:
- Qlik Cloud Data Integration
- Application Automation
- Lineage Connectors
- Direct Query
- Qlik Data Gateway - Direct Access
- PowerPoint Templates for Reporting
- Usage Homepage
2023 Qlik World Tour – U.S. Public Sector May 23rd in Washington DC
Don’t forget to register for our Public Sector Summit in Washington DC on May 23rd to hear from Qlik’s CEO and executives from DoD and other agencies on how Qlik Cloud Government has transformed their organizations.
The summit will cover everything from data integration to automation and analytics. If interested in migration strategies, check out the session Transitioning to Qlik Cloud: Navigating the Waters with Chase Boster, Qlik’s Professional Services Leader. If building enterprise data pipelines and change data capture is more up your alley, sign up for Jim Penn’s session - Qlik Cloud Data Integration: Deliver Real-time Data and Automate Transformation to Any Cloud!
Register now, link here!
Significant Releases:
1.Qlik Cloud Data Integration efficiently delivers large volumes of real-time, analytics-ready data into streaming and cloud platforms, data warehouses, and data lakes. And with an agentless and log-based approach to change data capture, your data is always current without impacting source systems. The platform enables a data fabric that delivers, transforms, and unifies your data across your organization via flexible, governed, and reusable data pipelines. These pipelines improve data freshness, reliability, and scale, essential for every analytics, ML, or digital transformation initiative. Watch video here.
2. Qlik Application Automation uses a no-code, drag-and-drop approach that helps you assemble automated flows that optimize processes, integrate SaaS applications and drive actions. These automations are fast to develop and eliminate the low-level complexity often required to automate back-office and analytics workflow activities. Check out the condensed overview and quick demo video below. Don't forget to check out the excellent resources at the end of this article. Watch the video.
What’s available now:
- Qlik Cloud
- Qlik Reporting Service
- Microsoft Teams on Office 365 Commercial and GCC
- Microsoft Excel Commercial and GCC
- Microsoft OneDrive Commercial and GCC
- Microsoft Outlook 365 Commercial and GCC
- Coming Soon: UiPath, ServiceNow, Slack
3. Qlik Lineage Connectors provide different connectors that allow you to extract and view data from different sources—providing full control over your data story. Qlik Lineage Connectors automatically gather metadata and lineage information from each targeted system. Watch the video.
Connectors available:
- QlikView
- Qlik Sense
- Qlik NPrinting
- Microsoft Power BI Services (including Microsoft O365 GCC and GCC High)
- Tableau
- Snowflake
- Azure SQL DB
- Microsoft SQL Server
- Microsoft SQL Server Integration Services (SSIS)
- Oracle DB
New Connectivity for both Cloud and On-Premises Sources!
4.Direct Query offers more options on how users can analyze data from cloud databases. Direct Query allows the user to keep the data in its underlying data source and generate SQL push-down as they interact with data through a Direct Query application. For performance, user experience, and data usage costs, it is recommended to leverage in-memory apps and Qlik’s Analytics Engine. Direct Query supports connectivity with Amazon RedShift, Databricks, Google BigQuery, and Snowflake. Learn more.
5. Data Gateway - Direct Access allows for safe, secure between Qlik Cloud Analytics apps and enterprise data that resides behind a firewall. This type of connection allows for enterprises to leave data where it is and safely consume through Qlik Cloud. Watch the video.
6. PowerPoint Template for Qlik Reporting Service
Users of Qlik Cloud Government can create automated multi-page reports based on a Qlik Sense app using the Qlik Reporting Service and Qlik Application Automation. Recipients either internal and/or external can receive complex, scheduled reports in PDF and PPT, even if they do not have access to Qlik Sense. Learn more.
7. Resource Consumption Monitoring
Administrators in the platform can monitor purchased and used amounts of different capacities in the Home pane in their Management Console. Learn more here.
Summary:
This latest release of products into Qlik Cloud Government showcases our investment into the platform for our U.S. Public Sector customers and has been purpose-built to support end-to-end data life-cycles. Qlik Cloud Government enables customers to shift from a passive form of business intelligence into an active environment that delivers real-time information and driving missions forward with insights and informed action. Stay tuned in for more deep dives into product features and upcoming releases.
Learn More at the QlikWorld Public Sector Tour! Register Here
-
Qlik Data Integration Client-Managed Releases in May 2023
As spring is now firmly in the air, our Qlik Data Integration Client-Managed portfolio continues to bloom with several new releases and updates for Ql... Show MoreAs spring is now firmly in the air, our Qlik Data Integration Client-Managed portfolio continues to bloom with several new releases and updates for Qlik Replicate, Qlik Compose and Qlik Catalog.
Qlik Replicate May 2023 General Availability Release
This latest edition of Qlik Replicate is the initial release for May 2023 and brings new endpoints and a slew of enhancements across endpoints, data types and server-side.
New Endpoints
New IBM DB2 for z/OS target endpoint - Based on customer feedback we are pleased to introduce native support for replicating data from any supported source to IBM DB2 for z/OS. This will help to improve mainframe base applications and data availability and support additional use cases such as.
- “Reverse ETL” to allow pushing enhanced data, like new or updated tables, back to the source.
- Database duplication - within the same or different environments enabling replication across Dev, Test, Acceptance and Production (DTAP).
New Google Cloud Pub/Sub target endpoint - We are excited to announce support for replicating data from any supported source to Google Cloud Pub/Sub. This has been a long-awaited streaming target endpoint for many customers.
New Google Cloud AlloyDB for PostgreSQL endpoints - As part of our ongoing technical and commercial partnership with Google, we are pleased to add support for Google Cloud AlloyDB for PostgreSQL as both a source endpoint and a target endpoint.
Endpoint Enhancements
SAP ODP (Operational Data Provisioning) as a Source
- SAP SLT support - Qlik Replicate May 2023 introduces support for replicating data from an SAP Landscape Transformation Replication Server this will dramatically assist customers who have existing investments in SAP SLT and improve the overall performance by leveraging Qlik Replicate SAP ODP endpoint
- Delta processing enhancements - Greater control is now available over delta processing. The “History data” mode has been added as the default mode. where all data will be applied as INSERTS, thereby preserving previous record versions. Additional new options are now available with this mode: Apply the original primary key, Reverse summable fields and Current data - When this mode is selected, the actual change operation (INSERT, UPDATE, or DELETE) will be performed on the target.
These new features build upon the previous enhancements made in the last November 2022 Service Release, these are listed below and are also included as part of the May 2023 GA
- Added Log Stream support - this allows customers wanting to use SAP ODP to take advantage of Replicate's Log Stream capability which will utilize log-based replication from a single source database and apply the changes to multiple targets without having the overhead of reading the logs for each target separately.
- Performance enhancement - we have resolved a performance issue related to table transformations and filters that some customers were affected by.
- Added support for SAP ODP version 1.1
IBM DB2 for z/OS source endpoint - data server client support – this improvement saves on disk space when running Qlik Replicate on Linux, by allowing installation of just the data server client, rather than the complete ODBC client package.
Oracle as a source endpoint - Log Stream tasks - now supports the source change position (e.g. SCN or LSN) Advanced Run option with the Oracle source endpoint.
Endpoint proxy server enhancements
Default proxy server support - You can now choose whether to use the default proxy server configured in the server settings or provide proxy settings specific to the endpoint. This option is supported with the following endpoints only:
- Databricks Lakehouse (Delta)
- Databricks Cloud Storage
- Google Cloud Big Query
- Amazon Redshift
- Microsoft Azure Synapse Analytics
Microsoft Azure Data Lake Storage (ADLS) Gen2 - For target endpoints that offer the option of using Microsoft Azure Data Lake Storage (ADLS) Gen2 storage, it is now possible to choose whether to use a proxy server to access the Staging storage and Azure Active Directory or either one of them.
Amazon Redshift target endpoint - AWS PrivateLink support – When using the Amazon Redshift target endpoint, you can now use AWS PrivateLink to connect to a virtual private cloud (VPC).
Support for Unity Catalog with Databricks endpoints – It is now possible to use Unity Catalog when using the Databricks Cloud Storage or Databricks Lakehouse (Delta) target endpoints.
Data type enhancements
Change to parquet data type mapping - The BYTES data type, which was previously mapped to FIXED_LEN_BYTE_ARRAY ($LENGTH) will now be mapped to BYTE_ARRAY. Note that this change only affects newly created endpoints, existing endpoints will continue to use the previous mapping.
This new data type mapping for the Parquet format has been changed for the following endpoints:
- Amazon S3
- Microsoft Azure ADLS
- Google Cloud Storage
Extended Parallel Load support with streaming targets- Data can now be loaded to the Kafka and Amazon MSK target endpoints using Parallel Load. In Full Load replication mode, you can use Parallel Load to accelerate the replication of large tables by splitting the table into segments and loading the segments in parallel. Tables can be segmented by date ranges, by partitions, or by sub-partitions.
Default quote character in file-based endpoints - New endpoints will be created with double quotes (") as the default quote character instead of an empty value. This change applies to the following target endpoints: Amazon S3, File, Microsoft ADLS, and Google Cloud Storage.
Microsoft Azure SQL (MS-CDC) endpoint - Geo Replica support - for reading events from Geo Replica.
Oracle HSM (Hardware Security Module) support - for reading data from both encrypted tablespaces and encrypted columns during CDC. This is true for both Replicate Log Reader and Oracle LogMiner to access the redo logs.
Server-side Enhancements
The Qlik Replicate May 2023 release comes with some new and enhanced server-side features.
Default proxy server - Instead of needing to configure a proxy server for each endpoint, you can now configure a default proxy server which can be used by all endpoints. To facilitate this functionality, a new Default proxy server section has been added to the server settings' Endpoints tab. Supported with the following endpoints only:
- Databricks Lakehouse (Delta)
- Databricks Cloud Storage
- Google Cloud Big Query
- Amazon Redshift
- Microsoft Azure Synapse Analytics
Support special characters in column names used in expressions - A new option has been added to support special characters in column names. e.g., “special#column”. This new option can be set globally for all tasks or individually for a specific task
Qlik Compose May 2022 Service Release 3
This is the third Service Release update to Qlik Compose May 2022 release. We continue to build on the initial release by enhancing both security and performance across several capabilities.
Snowflake Enhanced Authentication - we have taken a significant step toward enhancing security measures by introducing Key/Pair authentication to Snowflake. With this new feature, users can now opt for a public key-private key pair that is generated using Open SSL to ensure authentication and security of their data.
This enhanced security capability enables authentication providing an added layer of security, giving users the ability to write and read data to Snowflake with more confidence, making it easier for organizations to comply with more stringent security requirements while focusing on their core data engineering operations.
Code Generation Enhancements
20x efficiency gains - the performance of data warehouse ETL code generation has been significantly enhanced, focusing on cloud data warehouses and larger projects in Qlik Compose. We have seen up to 20x increases in efficiency for large-scale cloud data warehouse projects. As an example, generating ETL and SQL code for a project with over 500 entities, 1500 relations, and 3500 attributes, has been reduced to 1 hour (from 20 hours) without any changes in the execution time of the code.
Fine-Grained Control - Command line agility has also been greatly enhanced with the addition of fine-grained control over code generation via the command line interface (CLI). This feature now supports the generation of specific ELT tasks, making the process more agile and efficient. With the new ‘generate_task’ option you can define data warehouse or data mart tasks with faster and more granular control over your CI/CD process. This option makes it easier to isolate, debug, and fix any issues that may arise. Furthermore, the overall process becomes even more streamlined and efficient, with the ability to automate.
Qlik Catalog February 2023 Service Release 2
This update for Qlik Catalog continues to build upon the data load scheduling capabilities that were introduced in the November 2022 and February 2023 releases.
Schedule load jobs via cron - with this new option you can now schedule load refreshes based on a cron schedule. Cron is a command-line utility in Linux (and other Unix-like operating systems) that can be used as a job scheduler.
As always, each release is fully supported for two years. To find out more, please visit the Downloads and Release Notes section on Qlik Community.
[Please note: each product release will become available over the coming weeks in May, so if you don't see the product version you are looking for please come back]
We hope you enjoy using Qlik Data Integration products and would love to hear your feedback and success stories, especially in any improvement gains you achieve.
To learn more about what is included in these releases be sure to check out the Release notes which are available here
To obtain any of these releases, go to the Qlik Downloads Site in the Community and filter “Category” by “Qlik Data Integration”, and then select the product and the versions you would like to download.
Note: For most products, selecting “Latest release and patch” under the “Release Assets” should be enough.
If required, you can filter further by selecting the latest “Release” and/or Service Release (SR) version under “Release Number”.
For additional help in using the downloads site - watch this handy video guide here:
How-to-download-Qlik-Products -
Qlik Digest - May 2023
What's New at Qlik? Discover our new augmented analytics capabilities, extended transformation capabilities and much more in the next Qlik Insider Web... Show MoreWhat's New at Qlik?
Discover our new augmented analytics capabilities, extended transformation capabilities and much more in the next Qlik Insider Webinar on May 24. Register
Get the details on what’s included in the upcoming Qlik Sense release for May.
QlikWorld On-Demand
Hear from Qlik CEO Mike Capone and Chief Product Officer James Fisher to get the inside track on our latest innovations. And don’t miss rescue diver John Volanthen’s heart pounding account of the Thai cave rescue mission where he saved 13 lives. Watch now
Register for an upcoming Live Instructor Webinar!
Check out our Live Instructor Webinars covering a variety of advanced topics, from “getting a handle on hierarchies” to “advanced modelling challenges.” If you are unable to attend live, be sure to register to receive the on-demand recording. Learn more
Gartner® Magic Quadrant™
Qlik is recognized once again by Gartner® as a Leader in the 2023 Magic Quadrant™ for Business Intelligence and Analytics Platforms – our 13th year in a row! Get the report now
ADDITIONAL FEATURED CONTENT
- Customer Story - Time saved and revenue gained for Walker with Qlik
- Do More with Qlik - Join us on May 10 to create beautiful, custom themes in Qlik Sense
- Catch up on the latest connector factory releases
- Expand your Qlik Data Integration knowledge
- Qlik enables 40% accuracy improvement for United Safety
-
Ethics and AI
This was a really interesting article covering the ongoing debate about AI and how much it can either help or hurt us. It specifically called out the... Show MoreThis was a really interesting article covering the ongoing debate about AI and how much it can either help or hurt us. It specifically called out the need for more regulation when it comes to AI and ethics which I couldn't agree more one.
In my opinion I have not seen the benefits of AI just yet. I believe the invention of chat bots have caused an online culture of bullying and spreading misinformation and while I love how easy it is to create art with AI, it ultimately takes away the value that true artists bring to their craft.
Currently there are no regulations when it comes to AI and that makes it dangerous. While I don't like the idea of enforcing more rules, I am in favor of people having the right to know what was generated by actual humans and what was generated by AI. For now, companies can create their own guidelines as you will read in the article, salesforce has already done so and I am sure more will follow suite.
Learn more by reading the full article available

-
Continue your learning with Qlik Continuous Classroom!
Want to learn more about topics covered at Hands-on Workshops at QlikWorld? Qlik Continuous Classroom has you covered. Qlik Cloud Data Integration Han... Show MoreWant to learn more about topics covered at Hands-on Workshops at QlikWorld? Qlik Continuous Classroom has you covered.
Qlik Cloud Data Integration Hands-On Workshop:
FREE course: Using Qlik Cloud Data Integration to Onboard and Transform DataMigrating to Qlik Cloud Hands-On Workshop:
FREE course: Migrating to Qlik Cloud Learning PlanAccessing Data for Analytics Hands-On Workshop - Optimizing Cost vs. Performance vs. Business Requirements:
Introduction to On-demand App Generation and Introduction to Dynamic Views [Subscription required]Qlik Cloud Embedded Analytics Hands-On Workshop:
Course: Styling an App (qlik.com) [Subscription required]Introduction to Qlik AutoML Hands-On Workshop:
FREE courses: Introduction to Qlik AutoML, Qlik AutoML Multi Classification Model with a Link to all Qlik AutoML coursesAfter-hours Workshop: Amazing Visualizations:
FREE courses: Using Insights to Create Visualizations and Using the Default Sheet Editing View in the Cloud
-
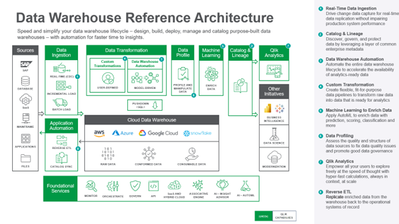
Qlik Use Case Reference Architecture - #1: Data Warehouse Reference Architecture
The architecture comprises the following components:Data is ingested from transactional systems with low latency. Change data capture for real-time da... Show MoreThe architecture comprises the following components:
Data is ingested from transactional systems with low latency. Change data capture for real-time data replication ingests data without impairing production system performance.
Data Warehouse Automation capability accelerates the availability of analytics-ready data by automating the entire data warehouse lifecycle.
Custom Transformation allows users to create flexible, fit-for-purpose data pipelines to transform raw data into data that is ready for analytics.
Data Profiling enables users to assess the quality and structure of data sources to fix data quality issues and promote good data governance.
Machine Learning enriches data with prediction, scoring, classification, and more.
Catalog & Lineage capabilities empower users to discover, govern, and protect data using AI and machine learning built on a layer of common enterprise metadata.
Analytics is used to discover, interpret, and communicate meaningful patterns in data to apply toward effective decision making
Reverse ETL replicates enriched data from the warehouse back to the operational systems of record.
-
New Qlik Application Automation and AutoML Courses
New Qlik AutoML Courses Four new courses are available to provide Machine Learning (ML) theory. Learn the difference between AI and ML, and how to fo... Show MoreNew Qlik AutoML Courses
Four new courses are available to provide Machine Learning (ML) theory.
Learn the difference between AI and ML, and how to formulate a machine learning question, review the features in your dataset to determine what possible issues may exist and how to resolve them, explore the different types of model scoring, and understand what composes prediction indicators and apply the predictions to real-world scenarios.
Qlik Application Automation Course
Learn how to trigger automated events, reports, and workflows in Qlik Sense and downstream applications, based on changing data, through a visual, no-code environment.
Access Qlik Application Automation Course
-
Continue Your Learning Post-QlikWorld with Qlik Continuous Classroom!
Missed QlikWorld’s Hands-On Workshops? Or Want to Learn More about the Workshop Topics? Qlik Continuous Classroom Has You Covered! Below are resource... Show MoreMissed QlikWorld’s Hands-On Workshops? Or Want to Learn More about the Workshop Topics? Qlik Continuous Classroom Has You Covered!
Below are resources for Qlik’s Hands-On Workshops at QlikWorld. Stay fresh or learn more about the Workshop’s topics with Qlik Continuous Classroom – many FREE self-paced courses!
Qlik Cloud Data Integration Hands-On Workshop:
FREE course: Using Qlik Cloud Data Integration to Onboard and Transform DataMigrating to Qlik Cloud Hands-On Workshop:
FREE course: Migrating to Qlik Cloud Learning PlanAccessing Data for Analytics Hands-On Workshop - Optimizing Cost vs. Performance vs. Business Requirements:
Introduction to On-demand App Generation and Introduction to Dynamic Views [Subscription required]Qlik Cloud Embedded Analytics Hands-On Workshop:
Course: Styling an App (qlik.com) [Subscription required]Introduction to Qlik AutoML Hands-On Workshop:
FREE courses: Introduction to Qlik AutoML, Qlik AutoML Multi Classification Model with a Link to all Qlik AutoML coursesAfter-hours Workshop: Amazing Visualizations:
FREE courses: Using Insights to Create Visualizations and Using the Default Sheet Editing View in the Cloud -
Alternate States for Comparative Analysis in Qlik Sense
When analyzing data with Qlik Sense, you might have come across the need to compare two sets of selections side by side. This is where the Alternate S... Show MoreWhen analyzing data with Qlik Sense, you might have come across the need to compare two sets of selections side by side. This is where the Alternate States feature come into play, allowing you to create different sets of selections and compare them in the same dashboard. In this blog post, we'll walk through the process of performing comparative analysis using alternate states in Qlik Sense including how to create it, apply it, and we’ll dive into how we can synchronize selections between the default state and alternate states.
What are Alternate States?
Alternate states in Qlik Sense can be thought of as multiple windows looking into the same app data model, allowing users to perform comparative analysis without losing or overriding other selections. Each state represents a unique perspective (For example, a Sales perspective, Operations, or Finance view) on the data, and these different windows or "states" can coexist within the same app without interfering with one another.
The normal operation of Qlik Sense involves a default state that affects the entire app when selections are made since every object in each sheet inherits from this state. However, this inheritance can be broken by creating new states for either sheets or individual objects, allowing them to exist independently and enabling side-by-side comparisons of charts. In this way, selections on different objects on the same sheet can co-exist without interfering with one another. This allows for having side-by-side comparison of charts.
Setting up the Alternate States
Let’s create two states for our example:
- Click on “Master Items” then ‘Alternate States”
- Select “Create new”
- Enter “State A” as the name.
Keep in mind that there are some naming limitations:
- Do not use $, 0, or 1 as a state name.
- Do not use a state name starting with $ or $_ followed by a number (for example $3).
- Do not use a state name already used as a bookmark name.
- Repeat the same for the second state and name it “State B”
- Add 2 filter panes with the “Country” field and 3 bar charts
- For each filter pane, go to Appearance > Alternate Sates and select State A and State B respectively.
- In the 2 bar charts, add “Country” as a dimension and “count of distinct Orders” as a measure.
Notice that now, if you try and make a Selection in either filter pane, nothing will happen to the Bar charts, that is because the selections are made to the newly created Alternate States whereas the bar charts are still in the default state.
Applying Alternate States
In order to make the selections on the Alternate states affect the visualization objects, we need to link them to these alternate states. We can do that in a variety of ways:
1- You can drag the newly created state from the left sidebar onto the visualization
2- You can go to the properties of the visualization, and under Appearance > Alternate states, choose the appropriate state from the dropdown (similar to what we did on the filter panes).
3- You can use Set Analysis to add the alternate state to the measure. Let’s use the following expression in our bar charts:
Count({[State A]} distinct orderID)
Count({[State B]} distinct orderID)
Bonus: Dynamic title for the Bar Charts.
If you want the title of the bar chart to reflect the selections of the respective alternate state, you can use the following expression:
='# of Orders '&GetCurrentSelections(chr(13)&chr(10), ': ', ',', 9, 'State A')
This will get the current selections in State A and comma separate them. Repeat this for State B.
Using Set Operators with Alternate States
It’s possible to use Set Operators (+, *, -, /) with states, meaning that we can do intersections, unions, exceptions etc... For example:
- Count({$ + [State A]} distinct orderID) -> will count the distinct orders in the union of the “Default” state and the alternate state “State A”.
- Count({1 - [State A]} distinct orderID) -> will count the distinct orders NOT in “State A”
- Count({[State A] * [State B]} distinct orderID) -> will count the distinct orders that are both in the intersection of ”State A“ and “State B”
Keep in mind that you should be cautions when using set operators in this manner. In some situations the result will not be what is expected. This is because the selections in a given state generate a set of data that may not be fully compatible with the set(s) it is being combined with. This is especially true as the complexity of the data model increases.
Synchronizing Selections between the Default state and Alternate States
When doing comparative analysis, you might run into a case where for instance you have 2 alternate states A and B, as well as the Default state.
Let’s say that we have 3 filter panes based on the field “Country” that have states A, B, and Default. In addition to that, we have 2 more filter panes with fields “Year” and “Month” that only have state Default.
If we’re only comparing Countries, we would be fine to make selections in all 3 “Country” filter panes to compare.
However, if we make a selection in either “Year” or “Month” filter panes which are only in the Default state, we can no longer see a clear comparison. So how can we solve that?
It’s simple, we can tweak the expressions in our 2 “alternate state”-bound measures to the following:
Count({[State A]<[orderDate.autoCalendar.Year] = $::[orderDate.autoCalendar.Year], [orderDate.autoCalendar.Month] = $::[orderDate.autoCalendar.Month]>} distinct orderID)

Count({[State B]<[orderDate.autoCalendar.Year] = $::[orderDate.autoCalendar.Year], [orderDate.autoCalendar.Month] = $::[orderDate.autoCalendar.Month]>} distinct orderID)
Notice that we have added the following set analysis syntax for both "Year" and "Month":
[orderDate.autoCalendar.Year] = $::[orderDate.autoCalendar.Year]
This means that we can keep selections for "Year" and "Month" consistent between states because when we select “Year” and “Month” in the Default states, these selections will be automatically applied to our Alternate States!
Conclusion
Comparative analysis is an essential tool for data analysis. Using alternate states in Qlik Sense makes it possible to compare two different sets of selections side by side. You can also go beyond the basics and leverage the power of Set Analysis to include Set operators or to automatically sync fields across states.
Attached is a QVF that has the example we went through!
Thanks for reading.
-
Connector Factory – April 2023 releases
Check out some of the newest connectors available in Qlik Cloud: New connector: API key This connector is designed for advanced users to connect with... Show MoreCheck out some of the newest connectors available in Qlik Cloud:
New connector: API key
This connector is designed for advanced users to connect with platforms that do not have any additional security requirements and do not yet have a dedicated Qlik Application Automation connector. The connector employs the API key authentication flow, which requires only the API key to make requests to a specific API. It supports the RAW API and RAW API LIST Request Blocks as well as common types of paging and rate limitations. You can find further details on this API key connector, including an example, here.
New connector: Basic Authentication
This connector is designed for advanced users to connect to platforms that have simple security requirements and do not yet have a dedicated Qlik Application Automation connector. It uses a basic authentication flow (i.e. username and password) to make requests to a specific API. Like the API Key Connector, this connector supports the RAW API and RAW API LIST Request Blocks as well as common types of paging and rate limitations. You can find further details on this Basic Authentication connector, including an example, here.
New connector: Oauth2
This connector is designed for advanced users to connect to platforms that utilize the standard 3-legged Oauth2 protocol for authorization and do not yet have a dedicated Qlik Application Automation connector. It uses a 3-legged Oauth2 authorization code flow to authenticate and make requests to a specific API. Like the other new connectors, it also supports the RAW API and RAW API LIST Request Blocks as well as common types of paging and rate limitations. You can further details on this Oauth2 connector, including an example, here.
-
Qlik announces the ability to transform data ingested by third parties or data-s...
Qlik identifies current ingested data using their "watermark pattern" to support an incremental loading pattern for data from third-party tools or dat... Show MoreQlik identifies current ingested data using their "watermark pattern" to support an incremental loading pattern for data from third-party tools or data-sharing agreements. Recognizing patterns makes the transformations that manage history efficient, allowing Qlik to integrate with existing data ingestion tools.
Data ingestion tools cost more if they track history. Hence, data engineering teams seek to reduce data ingestion costs by transforming ingested data and maintaining records as part of broader transformation capabilities resulting in reduced overall costs.
For existing Qlik customers, since Qlik Cloud Data Integration understands how Qlik Replicate delivers data, users can register, transform, and maintain the history of incrementally ingested data while creating a layer of real-time, live views over the data to reduce cloud computing expenses. Once users register the data into their pipelines, the complete transformation capabilities are available. Hence data engineering teams already having Qlik Replicate can reuse existing artifacts while transitioning to Qlik Cloud Data Integration.
Current Qlik Replicate customers expect to automate their transformations in their cloud data warehouses or lakes without managing on-premises software such as Qlik Compose. Their use cases range from custom SQL-driven output to operational data stores and data warehouses that follow patterns such as Kimball star schema, Inmon, data vault, and multi-zoned lakehouses.
Contact us to try the new capabilities in the latest release of Qlik Cloud Data Integration to automate data transformations and data marts via the Transform and Data Mart tasks.
-
Welcome back Marisa Sanchez! - Qlik Educator Ambassador Class of 2023
Marisa is still teaching at Universidad Nacional del Sur, Argentina, where she teaches a Business Intelligence course for the Business Administration ... Show MoreMarisa is still teaching at Universidad Nacional del Sur, Argentina, where she teaches a Business Intelligence course for the Business Administration bachelors; “We cover techniques to support decision making to build models from data such as data visualization and data mining, and based on mathematical models like simulation. We also give due importance to data analytics topics as we understand, this will better prepare students in their professional career. Each year we update the course. For example, last year we re-structured the course to assign more hours to Qlik training. Then, there are updates arising from new features in Qlik. Also, the material is translated to Spanish!”.
This is Marisa’s second term as an educator ambassador and since we last posted a blog about Marisa we asked her if any of her students had secured internships or jobs as a result of knowing Qlik, “Yes! Students not only get more job opportunities as a result of knowing Qlik but many decide to take more courses on data analytics after graduation. There is a great demand for data analytics capabilities and students prepare themselves to take the opportunities."
When it comes to looking ahead to 2023 Marisa says, “Our goal is to consolidate the way to Qlik training. The course data visualization contents are based on the Qlik Learning Portal. In addition, since we cover data mining, we aim to support some of the data mining projects using Qlik. We have scheduled a one-day seminar about Data Visualization using Qlik open to students, researchers and professionals. From a more personal stand, happy to dedicate more hours to gym that for many reasons I have found difficult to make time to fitness activities!.”
Since Marisa first joined our program, she has noticed a lot more challenges due the progression of technology but this comes with some positives, “Teaching activity is increasingly challenging because of all the innovations that should be incorporated every year, and at the same time, rewarding to offer contents of impact for the professional life of students. With the growth of data relevance, you no longer have to explain or convince the audience about the importance of acquiring data management skills.”
Marisa says she was eager to reapply to the Qlik Academic Program, “It is a great honor to be part of the Qlik Educator Ambassador Program because we can see how other educators use Qlik, get inspired by their achievements, participate in webinars given by important professionals in the area, and learn from customer success stories. In addition, the webinars open an easy communication channel with educators and Qlik staff. Being an Educator Ambassador gave more visibility among the university community, and the opportunity to share the benefits of the Academic Program.”
For more information about the Qlik Academic Program and how you can get access to free Qlik Sense software and training, visit: qlik.com/academicprogram
-
Qlik Data Visualization Showcase Re-Launches with New Visualizations and Resourc...
New features in the Data Visualization Showcase include, but are not limited to: Tooltips in charts Parallel coordinates Granular grid Chart backgrou... Show MoreNew features in the Data Visualization Showcase include, but are not limited to:
- Tooltips in charts
- Parallel coordinates
- Granular grid
- Chart background image and coloring
Updated charts include:
- Bar, Pie and Line chart font and styling updates
- Network chart
- Table indicators
Business intelligence and data analytics with actionable insights are essential for any organization striving to compete and win in their respective markets. Data visualizations make or break the interpretation of those insights.
According to Rob van Vliet, BI Product Owner at Medux, “Before I started working at Medux, I worked a lot with Tableau, and my first impression of Qlik was that they were lagging behind in the field of visualizations. Happily, Qlik caught up massively with Qlik Sense. We quickly realized that Qlik Sense could give us what we wanted, namely a user-friendly, accessible cloud solution which you can use to make excellent data visualizations. Qlik Sense would also enable the business units, where people have little or no programing skills, to analyze their data independently.”
Qlik Sense data visualizations will delight your data consumers and deliver better insights faster, with more responsiveness and detail than other products focused primarily on visualization. Combining Qlik’s analytics engine with our investment in foundational components, we have accelerated the pace at which we deliver world-class native visualization capabilities. And, we have released 200+ dynamic and flexible chart improvements in the past 18 months, so you can create practically any visualization that your analytics use cases require to support your innovation today and in the future.
You can look forward to quarterly updates to the Visualization Showcase.
-
NL Insights
The NL Insights object, found in the Qlik Dashboard bundle, allows app developers to add natural language generated insights to a sheet. The NL Insigh... Show MoreThe NL Insights object, found in the Qlik Dashboard bundle, allows app developers to add natural language generated insights to a sheet. The NL Insights object can be dragged to a sheet, just link other chart objects. Developers can use the NL Insights object to display an analytical summary of the data. This can accompany a single chart, a sheet, or the entire app. Once measures and/or dimensions are added to the object, narrative insights are automatically generated. The developer controls what data they would like to provide insights for based on their dimension and measure selections.
The image below is the Dashboard bundle.
Qlik Dashboard bundle
Properties window > Data section
After adding the master measure Sales $ (as seen in the image on the left), the insights below are generated. This is an example of using the NL Insights object to provide overall insights for an app. By default, all appropriate analysis types are used to generate the insights based on the dimensions and/or measures selected, but the developer can modify these if they choose. Up to three dimensions and three measures can be added to a NL Insights object. If the combination of dimensions and/or measures does not return any insights, a message will be displayed.
In the properties window, the developer can deselect any of the analysis types that they would like to remove from the auto-generated list. For example, in the image below, the selected analysis types can be removed by clicking on the “x” image next to the analysis type.
Properties window > Appearance section > Analysis types
According to Qlik Help, NL Insights can offer the following analysis types:
- Calculated measure
- Ranking
- Ranking (grouped)
- Breakdown (geospatial)
- Breakdown
- Overview
- Relative importance
- Year to date
- Trend over time
- Comparison
- Correlation
- Process control (means)
Natural language insights can also be used to accompany a specific chart. In the example below, a NL Insights object has the same dimension and measure that the line chart has and is used to provide a narrative of the chart. This can be useful to highlight important information. In this example, the style is set to bullet points, but it can also be set to sentences. Developers also have the option to set the verbosity to full or brief to show all recommendations or just the top recommendations. This example has verbosity set to full. Like other objects, insights are updated when selections are made in the app.
Users can benefit from NL Insights – a native capability that provides AI generated insights to users. Developers can give users a narrative summary of a chart, a sheet, or an app, to supplement visualizations in an app. A few things to note about the NL Insights objects – you can have up to three NL Insight objects on a sheet and if you add a new master item to your app, you will need to refresh the app before the new master items can be used in the NL Insights object. Try the NL Insights object out in your next app. To learn more, check out this SaaS in 60 video and Qlik Help.
Thanks,
Jennell
-
Qlik App Backup Script Using PowerShell
Qlik App Backup Script Using PowerShell Cummins-Meritor This PowerShell script will create automated backups of all Qlik Sense Client Apps (not ... Show MoreQlik App Backup Script Using PowerShellCummins-Meritor This PowerShell script will create automated backups of all Qlik Sense Client Apps (not cloud). Organized per stream and user.
Discoveries
Fully automated backups of all your apps on the file server, without data in it. Organized per user and per stream. Any number of versions that you want, automatically deleting older versions.
Impact
In this way, you can keep a backup of your apps in a safe place, without having to backup your whole server. Saving you time for managing backups and preventing the loss of hours of work.
Audience
Qlik Sense Client administrators. Qlik developers.
Data and advanced analytics
No data or analytics in this script.