Unlock a world of possibilities! Login now and discover the exclusive benefits awaiting you.
Analytics & AI
Forums for Qlik Analytic solutions. Ask questions, join discussions, find solutions, and access documentation and resources.
Data Integration & Quality
Forums for Qlik Data Integration solutions. Ask questions, join discussions, find solutions, and access documentation and resources
Explore Qlik Gallery
Qlik Gallery is meant to encourage Qlikkies everywhere to share their progress – from a first Qlik app – to a favorite Qlik app – and everything in-between.
Qlik Community
Get started on Qlik Community, find How-To documents, and join general non-product related discussions.
Qlik Resources
Direct links to other resources within the Qlik ecosystem. We suggest you bookmark this page.
Qlik Academic Program
Qlik gives qualified university students, educators, and researchers free Qlik software and resources to prepare students for the data-driven workplace.
Recent Blog Posts
-
You Asked, We Answered!
As we continuously gather your feedback on the Qlik Learning Portal, we have compiled a list of your most frequently asked questions and answered them... Show MoreAs we continuously gather your feedback on the Qlik Learning Portal, we have compiled a list of your most frequently asked questions and answered them for you on this blog post.
- I finished all the videos in the module, but my progress gauge isn’t showing as 100%. What should I do?
The Progress gauge does not update immediately and may take several minutes to do so. We recommend that you check back after 15 minutes, and it should then show as updated. If after 15 minutes it is still not updated correctly, please email Education@qlik.com.
2. English isn’t my first language. Is there were a way to translate the material on the learning portal?
We offer machine translations in 14 languages to our customers as a convenience to their learning experience and with awareness of its limitations. The translations are primarily focused in the Qlik Continuous Classroom, self-paced learning video's closed captions (not audio) and Qlik Learning Portal pages. To engage machine translations to translate the text to a different language, select a language from the language Dropdown:
After launching a video from a course page, select the CC button at the bottom of the video to display the closed captions with machine translations:
3.I’m not sure where I should begin my learning journey. Can you recommend a good starting point?
If you are unsure of where to start, we recommend starting with the Business Analyst for New Users plan. To locate this plan, click on the Continuous Classroom dropdown link and then choose Business Analyst for New Users under the Learning Plans section.
Once there, you will find a brief description of the plan, new user courses for the Business Analyst, as well as Qualification courses and Next Steps. All courses under the New User are free to access without a subscription so you can get started right away.
4. Is there a way to create a plan for myself that covers topics I am interested in learning?
You can create a custom learning plan that meets your specific needs. Use the top navigation Continuous Classroom drop down and choose Create Your Own under Learning Plans or click the quick link on your learning dashboard for Custom Learning Plan.
When you click the button to create your custom learning plan, you will be presented with a series of questions that assist in narrowing down the course options.
When you have completed the round of questions, click the Create Learning Plan button. Here you can give your learning plan a custom name by clicking on the Edit button under the Learning Plans and More title. You may also add or remove courses from the recommended list. When you are satisfied with your selections, click the Update plan button. You will be brought back to your Learning plan where you will need to click the Save Change button. Your new plan is now available to use and/or edit at any time.
You can create as many of these learning plans as you want. They are listed in the order you added them.
Have further questions? feedback?
On the right side of each course page, you can provide us feedback.
In less than one minute and one click you can let us know how we are doing, anonymously! We regularly review and consider this feedback for future curriculum updates.
Happy Learning!

-
Automated Insights through Insight Advisor in Qlik Sense - part of the fully Int...
Video 2 – Automated Insights through Insight Advisor in Qlik Sense These features are currently available, and we continue to innovate and expand th... Show MoreVideo 2 – Automated Insights through Insight Advisor in Qlik Sense
These features are currently available, and we continue to innovate and expand the breadth and depth of functionality. Insight Advisor delivers automated insights including visualizations and natural language insights by leveraging our unique associative engine combined with AI and ML and the business logic in your app. We will discuss Insight Advisor Search and Chat and our unique Analysis Types capability for generating advanced analytics in a few clicks. We will also demo our Natural Language Object, for deploying natural language insights directly within a sheet.
Visit the Playlist: https://www.youtube.com/playlist?list=PLW1uf5CQ_gSo5LpVJZgSTsT-gx80Jl89V
Can't see the video? Access to YouTube Blocked or Restricted? - Check out the playlist on the Qlik video page.
With automated insights and natural language analytics, we are delivering deeper and more powerful insights, as well as expanding access to data and driving efficiency. Business decision makers get a simple yet powerful way to quickly answer questions through chat, and also benefit from deeper insight they can explore in their dashboards. Analysts and content authors can easily create advanced analytics by choosing Analysis Types or using natural language search, reducing complexity and speeding time-to-value and efficiency. And with our robust business logic layer, insight generation and natural language processing can be customized for your unique business requirements. Chat, search and NLG are supported in over 11 languages.
Stay tuned for the next video in which we will be highlighting our embedded analytics and integration capabilities for Augmented Analytics, and demonstrating our exciting new Microsoft Teams Integration capability.
Read Next - Part 3 - Fully Integrated AI and ML
Read Part 1 - Qlik's Fully Integrated AI and ML Capabilities -
Qlik Digest - June 2023
What's New at Qlik? Qlik and Talend in Action - See the Demo Join us on June 20 as we unveil the strategic alliance between our two companies. Experie... Show MoreWhat's New at Qlik?
Qlik and Talend in Action - See the Demo
Join us on June 20 as we unveil the strategic alliance between our two companies. Experience a live demo and learn about the compelling reason behind this collaboration, the immediate advantages, and how it directly impacts you. Register Now
Say Hello to Instant Assistance
Our new generative AI chatbot is here to revolutionize your support experience! The bot is trained to instantly handle a wide range of support requests, and if you need further assistance, you will be connected directly to a live agent. This means fewer support tickets, less effort and more time saved for you! Chat with Qlik Support
AI and ML at Qlik
Tune into Qlik’s new AI and ML six-part video series. Learn about our broad capabilities for Augmented Analytics in Qlik Sense, AutoML for Predictive Analytics, and Data Science Integration. Plus, get a look in to what’s coming next! Learn More
Transform 3rd Party Data with Cloud Transformations
Qlik Cloud Data Integration can now transform data ingested by external tools and data stored in a data warehouse or lake. Transforming data in the cloud enables you to leverage automated transformations and pushdown processing to deliver business value while reducing data ingestion costs. Learn More
New Client-Managed releases for Qlik Data Integration Portfolio
Find out about the latest and greatest updates in our most recent Client-Managed releases. There are new endpoints in Qlik Replicate, security enhancements in Qlik Compose, data load scheduling developments in Qlik Catalog and much more! Learn More
Qlik Sense Qualifications Updates
Starting June 7 visit the Qlik Sense Business Analyst or Qlik Sense Data Architect Learning Plans to access the updated exams for 2023. Earn your qualification badge and share on your social sites!
Additional Featured Content
- Watch the inspiring stories of Qlik's 2023 Global Transformation Award Winners
- You asked, we answered - Qlik Learning Portal FAQs
- Discover the Cloud Advantage with Ikano Bank on June 14
- Seven Data Integration and Quality Scenarios for Qlik and Talend Solutions
- Qlik Advanced Analytics highlights global impact of flooding at Gartner Bake-Off
-
Computing Degrees Increasing in Popularity
As of February, the number of young people in the UK applying to study computing has risen by 9.6%. This is more than for any other university subjec... Show MoreAs of February, the number of young people in the UK applying to study computing has risen by 9.6%. This is more than for any other university subject, according to the chartered institute of IT. Part of this increase has come from a rise in the number of female students applying for computing degrees, figures from UCAS show that there was an increase of 18%, this is higher than any other degree course.
This could be due to a number of reasons such as the high profile rise of artificial intelligence. Young people are increasingly curious about emerging technologies and their relevance in their future lives and careers. In addition to this there is a growing awareness around the role and importance of data, with many students pursuing degrees in areas such as cybersecurity and data science. Since the pandemic forced everyone to stay home, the role of technology in our day to day lives became clearer, many young people now have a greater awareness of emerging technologies and the career opportunities they offer. In addition to this, the younger generation understand that these trends are not likely to change, so pursuing careers such as software engineering or data analytics provide a lot of job security.
This spike in applications for computer-based degrees has also meant that more students are choosing to take GCSE’s and A Levels in computing subjects too. The number of students choosing to sit computing exams at A-level rose for the fourth year in a row in 2022, and there was also an increase in the number of students taking the subject at GCSE level.
Even if students are not choosing to take a computing or data-based degree at university, they can still upskill themselves ready for the data driven world with the Qlik Academic Program. Our free courses on visualizations can be used alongside free Qlik Sense software access so that students can study both the theory and the practical elements too. Our program also offers a wide range of data literacy programs, as well as entry level courses on data analytics and advanced courses on data analytics. To learn about how students and educators at accredited universities can get free access, follow this link: qlik.com/academicprogram.
Articles used for this blog:
https://www.computerweekly.com/news/365531434/Computing-degrees-more-popular-due-to-AI-says-BCS
-
Natural Language API Now Available for Developers in Qlik Sense
Qlik has released the Natural Language Engine API for developers! The API allows developers and creators the ability to enhance their analytics enviro... Show MoreQlik has released the Natural Language Engine API for developers! The API allows developers and creators the ability to enhance their analytics environments by building their own client for Insight Advisor Chat within internal embedded solutions or enterprise chat bot platforms.
The Insight Advisor currently found within Qlik Sense already offers the convenience of conversational analytics but now with the Natural Language API, the power is yours to develop your own! Enrich your user’s analytics journey by providing augmented experiences like chat analytics and insight suggestions.
Click to link to video transcript
Want to build your own chat bot?
Visit our tutorial on Qlik.Dev here to discover how to build your own chat bot and leverage the Natural Language API.
Available in Qlik Sense SaaS and where Client-Managed versions have the Chat add-on included. Keep note that when developing with APIs, the overall experience from the Insight Advisor found in-app will be different than the experience via the API.
-
Connector Factory – May 2023 releases
Qlik Cloud Analytics: Google Analytics 4 Qlik has added a new connector to Qlik Sense Client-Managed called Google Analytics 4 which utilizes Google’... Show MoreQlik Cloud Analytics: Google Analytics 4
Qlik has added a new connector to Qlik Sense Client-Managed called Google Analytics 4 which utilizes Google’s new APIs. This latest version of Google’s Analytic service is a more flexible measuring tool that can collect event-based data from many different kinds of websites and apps. Note that the existing Qlik Google Analytics connector will continue to be supported until Google retires the old analytic service later this year.
Qlik Application Automation: ServiceNow
ServiceNow is a cloud-based solution that provides technical management support, such as IT service management, to the IT operations of large corporations. Qlik Application Automation already provides a ServiceNow connector but now this connector is also available within Qlik Cloud Government. Qlik Cloud Government is a slightly different edition of Qlik Cloud that is only available for the U.S. Public sector due to required security protocols.
About Connector Factory
Check out Mike Tarallo’s “Do More with Qlik” Tips and Tricks edition video series to learn more about some of the latest product enhancements and Explore here
-
Tips and Tricks: Creating a Multi-layer Drilldown Map with different layer types
This video shares a few tips when creating a drilldown map. Qlik Help - Drilldown Dimension: https://help.qlik.com/en-US/cloud-services/Subsystems/Hu... Show MoreThis video shares a few tips when creating a drilldown map.
- Qlik Help - Drilldown Dimension: https://help.qlik.com/en-US/cloud-services/Subsystems/Hub/Content/Sense_Hub/Dimensions/create-drill-down-dimension.htm
- Qlik Help - Map Chart https://help.qlik.com/en-US/cloud-services/Subsystems/Hub/Content/Sense_Hub/Visualizations/Map/Map.htm
- Playlist: https://www.youtube.com/playlist?list=PLW1uf5CQ_gSqF5bcmbBrk1q7Q4-h899V1
- Create a Drilldown Dimension in Master Items
- Fully qualify location fields if needed
i.e. =city&','&province_code&','&country_code
- Use that Drildown Dimension in your Map Layer
- Control layer display at the appropriate drill level

- Qlik Help - Drilldown Dimension: https://help.qlik.com/en-US/cloud-services/Subsystems/Hub/Content/Sense_Hub/Dimensions/create-drill-down-dimension.htm
-
Unbalanced, n-level hierarchies
Hierarchies are very common in all database and business intelligence solutions. Usually they are balanced and with a fix number of levels, and then t... Show MoreHierarchies are very common in all database and business intelligence solutions. Usually they are balanced and with a fix number of levels, and then they do not pose any problems. Just load the data, add a drill-down group, and you’re done.
But there is one type of hierarchy that is somewhat tricky to get right – an unbalanced, n-level hierarchy. Typical for this type of hierarchy is that the levels are not named, and you really don’t know on which level you need to search for a specific node.
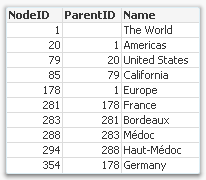
Usually such a hierarchy is stored in an Adjacent Nodes table, i.e. a table that has one record per node and each node has a reference to its parent.
Such a table can be loaded into QlikView directly using the Hierarchy prefix. This prefix will transform the Adjacent Nodes table into an Expanded Nodes table that has additional fields that you can use in your app.
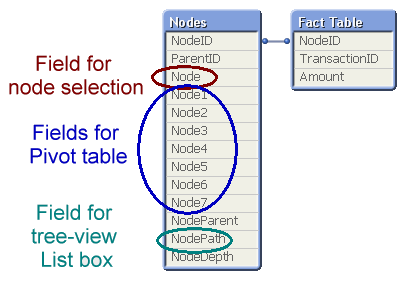
With the fields in this table, you can easily create a pivot table and a tree-view list box. Below you can see some wine districts displayed in both these object types:
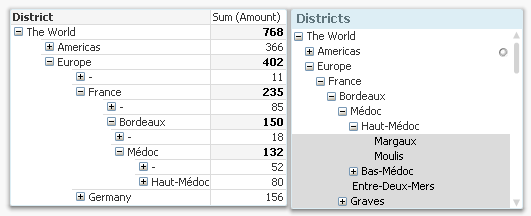
One challenge with hierarchies is that you can refer to a node in two different ways: Either to the node including the entire sub-tree, or to the node only, excluding all sub-nodes. In the example with the wine districts, it would mean any wine from Bordeaux, and unspecified Bordeaux, respectively. In the pivot table above, the difference is obvious: Any wine from Bordeaux sums up to 150 units, and the unspecified Bordeaux sums up to 18 units.
A user usually wants to make selections referring to the entire sub-tree, but the above solution does not have any field for this. To create such a field, you need the second hierarchy-resolving prefix – the HierarchyBelongsTo.
This prefix will also transform the hierarchy table. The result will be a table containing one record per descendant-ancestor pair. In other words, the ancestor (tree ID) will link to all its descendants (node ID), and can thus be used to make selections of entire sub-trees. (The “TreeBridge” table in the picture below.)
But it doesn’t stop here… The above solution creates one field in which tree searches can be made, but in order to create a drill-down for trees, you need an additional table – an expanded nodes table for the trees. This can be created with a second Hierarchy statement, but now one that links to the tree ID instead of the node ID. (The “Trees” table in the picture below.)
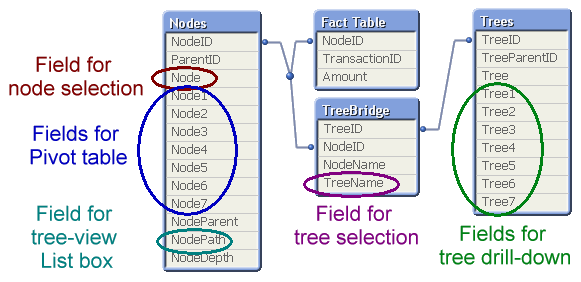
The data model with the three hierarchy tables is the one I recommend: It generates all fields you need.
A more elaborate explanation with script examples can be found in the technical brief about Hierarchies.
Further reading related to this topic:

-
Sankey Charts: Contribution and Distribution
In our previous entries in the coverage of Qlik’s available charts, we covered bar, line, and pie charts, some of the more widely known types. Today w... Show MoreIn our previous entries in the coverage of Qlik’s available charts, we covered bar, line, and pie charts, some of the more widely known types. Today we’re going to delve a bit deeper and look at a lesser-known chart called a ‘Sankey chart’.
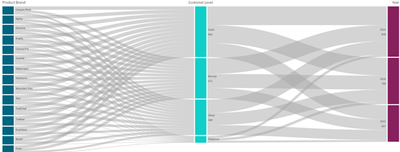
A Sankey chart is a visualization used to depict a flow from one set of values to another. The charts are divided into two basic elements, the nodes, and the paths, sometimes these paths or flows are shown in the shape of arrows.
It might be easier to think of these charts like a river system. While there may be many or few different inlets to a river’s flow, they filter into different channels of water, and are distributed in different ways.
For the example above, we have the ‘Product Brand’ node that filters into the ‘Customer Level’ node. This visualizes the amount of products being bought by each customer level with the thicker lines representing more sales. From this section of our chart, we can see that ‘Gold’ level customers are buying the most products, while ‘Platinum’ level customers are buying the least. Moving further down the line of the chart, we can see how the purchases of these customer levels are distributed by year, from this chart we can see that 2021 holds the most, with 2020 in second and 2022 in third.
So how would we use these charts?
We could use this chart to see the distribution of resources. We could see which resources are being sent to which regions, and by how much. We could then filter these results further to show which sections of these regions are using the most, or least amount.
When using a Sankey chart, it is important to remember two words: distribution and contribution. How are the amount of one data point being distributed to another data point, and how are these data points contributing to the other data points. Not only are we showing direction, we’re showing amount as well.
Thank you for giving this blog a look. Hopefully you now have a better understanding of how Sankey charts are used. How can you use a Sankey chart in your own apps? How would they be useful to you or your company? Is there something I might have missed? Leave me a comment down below to further the discussion on Sankey charts!
-
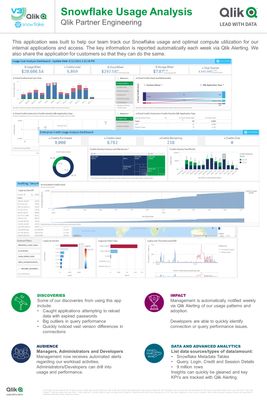
Snowflake Usage Analysis
Download the latest and greatest version of the application from GitHub here: https://github.com/Qlik-PE/Snowflake-Usage-Analysis-Dashboard Show MoreDownload the latest and greatest version of the application from GitHub here: https://github.com/Qlik-PE/Snowflake-Usage-Analysis-Dashboard
-
Calling All APAC Data Lovers!
With Qlik’s Analytics Expert Program “Applied Data Analytics using Qlik Sense”, in just 15 weeks, you will be on your way to become a leader in develo... Show MoreWith Qlik’s Analytics Expert Program “Applied Data Analytics using Qlik Sense”, in just 15 weeks, you will be on your way to become a leader in developing a data-driven culture in your organization.
You will not only learn data analytics best practices but also learn how to achieve a data-informed mindset that shifts you from just looking for data and information to looking for insights and knowledge.
Register Today to save your spot
Looking for more details? Check out our Course Page to access Data Sheet, Sample course and all other details.
Happy Learning!
-
【オンデマンド配信】QlikWorld 2023 ダイジェスト Web セミナー
今年 4月、毎年恒例の最大級のデータイベント「QlikWorld 2023」が、米国ラスベガスで開催されました。特別ゲストおよび Qlik エグゼクティブによる基調講演をはじめ、100 以上のセッションや実践的なワークショップ、グローバルトランスフォーメーションアワード授与式など、データ愛好家が一... Show More今年 4月、毎年恒例の最大級のデータイベント「QlikWorld 2023」が、米国ラスベガスで開催されました。
特別ゲストおよび Qlik エグゼクティブによる基調講演をはじめ、100 以上のセッションや実践的なワークショップ、グローバルトランスフォーメーションアワード授与式など、データ愛好家が一堂に会した 4 日間は、連日盛況のうちに終了しました。
本 Web セミナーでは、Qlik の日本の営業および技術者が、QlikWorld 2023 でご紹介した内容をわかりやすくまとめてお届けします。Qlik のビジョンや製品ポートフォリオ、最新のユーザー事例、Qlik で先進的なビジネス成果を挙げている企業に授与されるグローバルトランスフォーメーションアワードのほか、実際に参加した営業担当者が現地でのイベントの様子をご紹介します。ぜひ、データ活用のすべてを網羅した「QlikWorld 2023」をダイジェストでご視聴ください。※ 参加費無料。パソコン・タブレット・スマートフォンで、どこからでもご視聴いただけます。日本語字幕付きでお届けします。
-
2022 FIFA World Cup Teams
2022 FIFA World Cup Teams AnyChart — QS Extensions Explore Qatar 2022 teams by league and club with remarkable Decomposition Trees. Discov... Show More2022 FIFA World Cup TeamsAnyChart — QS Extensions Explore Qatar 2022 teams by league and club with remarkable Decomposition Trees.
Discoveries
Investigate how the national football/soccer teams of all 32 participating countries in the 2022 Qatar World Cup are made up of players from various leagues and clubs, using remarkable Decomposition Tree visualizations in Qlik Sense. (Re)arrange the order of the represented dimensions depending on how you want to disaggregate the totals. Analyze goals and caps for national teams similarly using intuitive decomposition trees.
Impact
Check out how AnyChart's Decomposition Tree works and how it can help you explore data across multiple dimensions.
Audience
Anyone who wants to analyze the 2022 Qatar World Cup's teams and see an example of a decomposition tree in Qlik Sense in action.
Data and advanced analytics
This application features decomposition trees built with AnyChart's Decomposition Tree extension for Qlik Sense.
🔗 >> VIEW IT LIVE OR DOWNLOAD (.QVF) <<
-
【6/7(水)14:00 - 15:00 開催】Web セミナー:Qlik と Dr.Sum で、散在するデータの再活用を促進!
データドリブンな組織づくりを推進しようと、データ活用を推し進める企業が増えてきました。社内に散っている多種多様なデータの統合や、BI ツールを使った可視化・分析を進めているものの、まだ部分的、あるいは分断的に導入されているケースが多く見受けられます。本質的なデータ活用に向けては、これらが一気通貫で実... Show Moreデータドリブンな組織づくりを推進しようと、データ活用を推し進める企業が増えてきました。社内に散っている多種多様なデータの統合や、BI ツールを使った可視化・分析を進めているものの、まだ部分的、あるいは分断的に導入されているケースが多く見受けられます。本質的なデータ活用に向けては、これらが一気通貫で実現され、誰でもデータにアクセスし分析できること、そしてデータをもとに行動できる状態にあることが必要不可欠です。
本セミナーでは、基幹システムなどさまざまなデータソースからほぼリアルタイムでデータを取得できる Qlik のデータ統合製品「Qlik Replicate」と、プログラミングを必要とせずビジネスユーザーが直感的に使える BI ツール「Qlik Sense」と、データ分析基盤として国内シェア No.1* を誇るウイングアーク 1stの「Dr.Sum」の連携によって、データ活用の用途の幅をどのように広げていくのかをご紹介いたします。
*出典:ITR「 DBMS/BI 市場 2021」データ分析/レポーティング市場:ベンター別売上金額推移およびシェア詳細を見る
【開催概要】
日時:2023年 6月 7日(水)14:00 - 15:00
会場:オンライン
参加費:無料 -
【7/7(金)14:00 - 17:00 開催】共催セミナー:データ分析の新時代を切り拓く
※2023年 6月 2日(金)開催予定でしたが、悪天候のため、延期となりました。 本イベントは、データ分析と AI 技術に関心のあるビジネスリーダーや分析担当者を対象とし、最先端のテクノロジーを活用して、データドリブンなビジネスの成功を実現する方法や、ビジネスにおけるデータ分析と AI 技術が果たす... Show More※2023年 6月 2日(金)開催予定でしたが、悪天候のため、延期となりました。
本イベントは、データ分析と AI 技術に関心のあるビジネスリーダーや分析担当者を対象とし、最先端のテクノロジーを活用して、データドリブンなビジネスの成功を実現する方法や、ビジネスにおけるデータ分析と AI 技術が果たす役割について学ぶことができます。
Snowflake、Qlik、DataRobot の 3 社から、それぞれの企業が提供するソリューションの概要や、それらを組み合わせてどのようにデータドリブンなビジネスの成功を支援するかについてご説明します。Snowflake は、クラウドベースのデータウェアハウスであり、高速で柔軟なデータ処理を提供します。Qlik は、分析のためのデータ基盤を構築するデータ統合と、データ可視化・分析のためのユーザーフレンドリーなインターフェースを備えたビジネスインテリジェンスを提供します。DataRobot は、自動化された機械学習プラットフォームであり、モデルの構築、トレーニング、評価を簡単かつ迅速に行うことができます。
アシストは、参加者の方が自社のビジネスに適した戦略やツールを見つけ、競争優位性を獲得するためにデータドリブンなアプローチを採用することを支援いたします。
詳細を見る
【開催概要】
日時:2023年 7月 7日(金)14:00 – 17:00
会場:株式会社アシスト 西日本支社会議室
大阪市北区大深町4-20 グランフロント大阪タワー A 13F
参加費:無料 -
Rugby World Cup Japan 2019: stats and analytics
To celebrate the start of the tournament we are launching our own app including Rugby World Cup Japan 2019 stats and analytics. We’ve partnered with G... Show MoreTo celebrate the start of the tournament we are launching our own app including Rugby World Cup Japan 2019 stats and analytics. We’ve partnered with Gracenote as data provider and we’ve built a responsive Qlik Sense mashup that contains the tournament’s KPIs and stats.
The two major features of this app are the live updating match details and historical data from every tournament.
The live match details will update in real time and allow you to follow key metrics from the matches as they happen on the pitch. In the picture above you can see the first game of the tournament updated in our app.
The historical statistics shows team details like finishes, aggregated statistics (tries, conversions, penalties, drop goals, etc.), key player statistics and more.
The Teams page shows a team ranking by different metrics and let you check all the details about favorite team.
You can see the app live here: https://webapps.qlik.com/rugby-world-championship/index.html
We hope you enjoy the Rugby World Cup and our data app as well 😉
Arturo (@arturoqv)

-
Qlik's Fully Integrated AI and ML Capabilities - Today and the Path Forward (tun...
In this first video, we introduce our overall approach, discuss what makes it unique, and describe our end-to-end capabilities and benefits that drive... Show MoreIn this first video, we introduce our overall approach, discuss what makes it unique, and describe our end-to-end capabilities and benefits that drive deeper and more meaningful insight, make that insight more accessible to all decision-makers, and speed up the time-to-value through automation. Unlike other solutions, Qlik offers fully integrated AI and ML built into our platform as foundational services, not a “bolt-on” or one-size-fits-all approach. We deliver a complete set of augmented capabilities, where we can “cross-pollenate” by leveraging ML-driven capabilities in Qlik Sense and Qlik Sense analytics in AutoML. The result is an end-to-end solution delivering the right experiences to users of all skill levels, helping them reach their full potential with data.
Watch the first Video of our series here:
Can't see the video? Access to YouTube Blocked or Restricted? - Check out the playlist on the Qlik video page.
In future videos you will get a deeper look at some current and future capabilities unveiled at Qlik World. This includes insight generation in Qlik Sense featuring Automated Insights and Natural Language, ML services with a preview of Key Driver Analysis, and Integrations with a look at Microsoft Teams Chat. You’ll also hear AutoML and predictive analytics, including our approach and a walkthrough of the predictive analytics life-cycle in Qlik AutoML, and resulting analysis in Qlik Sense. Stay tuned!
Read Next Blog here
-
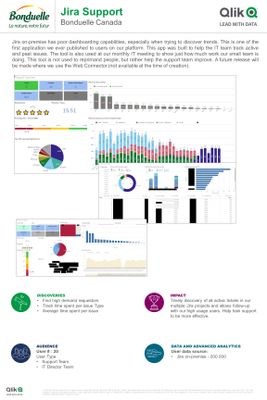
Bonduelle - Jira Support
Jira on-premise has poor dashboarding capabilities, especially when trying to discover trends. This is one of the first application we ever published ... Show MoreJira on-premise has poor dashboarding capabilities, especially when trying to discover trends. This is one of the first application we ever published to users on our platform. This app was built to help the IT team track active and past issues. The tool is also used at our monthly IT meeting to show just how much work our small team is doing.
This tool is not used to reprimand people, but rather help the support team improve. A future release will be made where we use the Web Connector (not available at the time of creation).
-
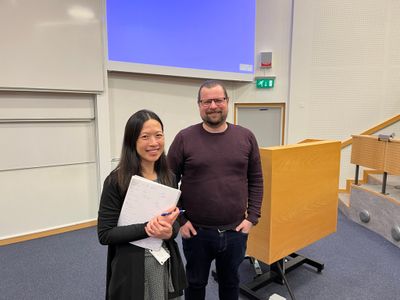
Digital Accounting students get to grips with Qlik
At Lund University our regional champion Ola Roxendell kicked off the term with an introduction to Qlik for Masters students studying a course in Digi... Show MoreAt Lund University our regional champion Ola Roxendell kicked off the term with an introduction to Qlik for Masters students studying a course in Digital Accounting, taught by Amanda Sonnerfeldt. At the end of this introduction Ola set the students an assignment in Qlik Sense that they had to work on in groups ready to present back to the class.
The assignment asked students to use Qlik to find a solution to Out of Stock issues. Firstly, they had to explore just how much of an impact on the business OOS issues were having. Then they had to build a dashboard to monitor business performance in a clear and concise way across various business indicators, for example, current stock levels, highest selling products, inventory. Students had to find the most suitable visualization for each business indicator and summarize their findings along with suggestions of what future action should take place. For example, what were the main causes of the OOS risk? What action is driving this? How can it be improved? Students had to address how BI could help with these issues and provide a solution. They were also required to explore the limitations of relying on a BI tool, in many cases students highlighted the lack of data skills among employees.
In some cases, students went beyond the dashboard build and used the storytelling functionality within Qlik Sense, embedding visualizations into a presentation that they could easily revisit in their app. The students had one lab session where they were able to bring their laptops to class and start working on their assignment with Ola and Amanda available to answer any questions or give any guidance. Outside of their classes they had to collaborate with their team to solve the task.
Students delivered some amazing work that very much impressed Amanda and Ola. Ola says; “Getting to be part of the course curriculum allowed us to go deeper into our product. They students presented their own visualizations and a report where they solved a business problem related to there field. I’m very impressed with their work, they put a lot of effort into it and it showed in the result.”
If you’re an educator and you’d like to make analytics a part of your course, our Qlik Academic Program can support you. We provide free software and training resources and can guide you through how to embed these into your teaching. To learn more follow this link qlik.com/academicprogram
-
Qlik | Talend:未来が今ここに(Qlik Blog 翻訳)
ブログ著者:Mike Capone 本ブログは Qlik | Talend: Looking Forward の翻訳になります。 私たちは常に前を向き、最も包括的で信頼できるソリューションをお客様に提供することに重点を置いてきました。このたび、Talend のクラウドデータ統合とデータ品質ソリ... Show Moreブログ著者:Mike Capone 本ブログは Qlik | Talend: Looking Forward の翻訳になります。
私たちは常に前を向き、最も包括的で信頼できるソリューションをお客様に提供することに重点を置いてきました。このたび、Talend のクラウドデータ統合とデータ品質ソリューションにより、さらに多くのことを提供できるようになりました。Talend の買収と、イノベーションと研究開発への継続的なコミットメントにより、Qlik はデータ統合、データ品質、アナリティクスのリーダーとなります。
私たちの業界には、市場を一変するような素晴らしい機会があります。一方で、企業のCIO が周囲を見渡した時に、選択肢が十分ではないという現実があります。
- 大きな頭痛の種となる(しかも実績の少ない)複数の単体製品
- 現在のニーズ(あるいは将来のニーズ)を満たさない不完全なレガシー製品
- ベンダーロックインを引き起こすハイパースケーラー(それが彼らのビジネスモデルです)
今日、私は新しいアプローチを発表できることを誇りに思います。最新で、実績があり、信頼できる、そしてオープンでクラウドの種類にとらわれないクラス最高のソリューションの広範なソリューションセットです。つまり、Qlik と Talend が一緒になることで、お客様は技術的負債とコストを排除し、信頼できるデータが最も重要な時に意思決定に利用できるという確信を高めることができるようになるのです。
さらに、Qlik と Talend の両社には輝かしい歴史があります。複数の市場カテゴリーで主要なソリューションプロバイダーとしての地位を獲得したことを光栄に思うとともに、今後もお客様の既存投資をサポートすることに全力を尽くします。ガートナーは、Talend を 7年連続でデータ統合ツールのマジック・クアドラントのリーダーに、5年連続でデータ品質ソリューションのマジック・クアドラントのリーダーに位置付けています。また、Qlik は 13年連続でマジック・クアドラントのアナリティクスおよびビジネス・インテリジェンス・プラットフォーム部門でリーダーに選ばれています。さらに、「IDC MarketScape:U.S. Business Intelligence and Analytics Platforms 2022 Vendor Assessment」においてもリーダーに選ばれています。
私の前職は CIO でしたがその際は、信頼できる少数のパートナーとソリューションを構築し、望む成果のために投資していました。そして私たちは Qlik をそういう会社として築いてきました。今日、私たちは世界中のパートナーエコシステムとともに未来に目を向け、業界最高のデータ統合、データ品質、アナリティクス、AI、機械学習ソリューションを提供いたします。
Talend チームを Qlik に迎え、皆様に「未来」をお見せするのがとても楽しみです。
統合されたポートフォリオの詳細についてはウェビナー「 Qlik | Talend: What's Next is Now」をご視聴ください。