Unlock a world of possibilities! Login now and discover the exclusive benefits awaiting you.
Analytics & AI
Forums for Qlik Analytic solutions. Ask questions, join discussions, find solutions, and access documentation and resources.
Data Integration & Quality
Forums for Qlik Data Integration solutions. Ask questions, join discussions, find solutions, and access documentation and resources
Explore Qlik Gallery
Qlik Gallery is meant to encourage Qlikkies everywhere to share their progress – from a first Qlik app – to a favorite Qlik app – and everything in-between.
Qlik Community
Get started on Qlik Community, find How-To documents, and join general non-product related discussions.
Qlik Resources
Direct links to other resources within the Qlik ecosystem. We suggest you bookmark this page.
Qlik Academic Program
Qlik gives qualified university students, educators, and researchers free Qlik software and resources to prepare students for the data-driven workplace.
Recent Blog Posts
-
MENUBAR
MENUBARTRUECHART.comThe MENUBAR allows for vertical and horizontal buttons and selections (fields, drill-down dimensions, master dimensions & variable... Show MoreMENUBARTRUECHART.com The MENUBAR allows for vertical and horizontal buttons and selections (fields, drill-down dimensions, master dimensions & variables) as well as unlimited trigger-based Actions. In addition, you can share apps with the current selection, as well as conveniently chain documents including current or changed selections to navigate between apps.
Discoveries
MENUBAR improves Qlik Sense and adds customizable navigation elements to your preferred BI tool - restoring the features of QlikView within your QlikSense installation. Join thousands of MENUBAR users now.
Impact
Agility, speed, easier for non-business analysts, triggers action.
Audience
business analysts, functional managers.
Data and advanced analytics
Visit website at https://www.truechart.com/software/menubar.
-
QlikWorld’s Appreciation Night – An Unforgettable
An epic night to remember is headed your way! On Wednesday April 19th, we will celebrate our event’s last night together at the world-class Allegiant ... Show MoreAn epic night to remember is headed your way!
On Wednesday April 19th, we will celebrate our event’s last night together at the world-class Allegiant Stadium, home of Las Vegas's First professional football team!
Fun for everyone! The Ultimate Football Fan Fest and behind the scenes experience.
Play like a professional football player. Run through skills and drills, catch an endzone pass and kick a once in a lifetime field goal.
Explore Allegiant Stadium as you make your way through exclusive venue pathways to discover treasured spaces including Coors Light Landing.
Entertainment. Food. Cocktails. And more! Transportation will be provided. Register now! Can’t wait to see you there!
-
Qlik Digest - April 2023
The Qlik Visualization Showcase is back! Our popular Visualization Showcase has relaunched, featuring new visualizations and tips, as well as addition... Show MoreThe Qlik Visualization Showcase is back!
Our popular Visualization Showcase has relaunched, featuring new visualizations and tips, as well as additional resources highlighting our unique and powerful capabilities. Learn More
Harnessing Data for Sustainability
As climate change effects become more evident, corporations strive to become more sustainable. Learn how organizations like The UN and Deloitte use data to strengthen their sustainability efforts. Read E-Book
Final Call for QlikWorld 2023
Don’t miss your final chance to join us in Vegas from 17-20 April. Your conference pass includes 100+ breakout sessions, 10+ hours of immersive workshops worth $1000, and a free certification! Register Now
Gartner releases new Process Mining Magic Quadrant™
Gartner has just released its first-ever Magic Quadrant™ for Process Mining Tools. We’re very proud to share that our strategic partner MEHRWERK has been recognized as a Leader in this report for its Qlik®-based process mining solution mpmX. Get the report
ADDITIONAL FEATURED CONTENT
- Register for our next analytics roadmap and strategy session on April 27
- See what’s new in our latest Data Integration Client-Managed release
- Hunt Electric implement Qlik Cloud in just one day
- Get the new and improved Qlik Sense SaaS Mobile App
- Participate in our May Customer survey, look out for an email invite or a pop-up in Qlik cloud.
-
Activity trackers and Analytics - Strava Activity Tracking (v2)
Activity trackers and Analytics - Strava Activity Tracking (v2)Dave ElliottA fun, personal project to track activities through Strava, including the f... Show MoreActivity trackers and Analytics - Strava Activity Tracking (v2)Dave ElliottA fun, personal project to track activities through Strava, including the functionality to track like for like activities side by side through alternate states. The app pulls data direct from Strava through the connector, with downloaded gpx files stored in Amazon S3 as xml files accessed and presented to support activity mapping.Discoveries
Understand more about how to incorporate Amazon S3 in to Qlik Sense apps for accessing data, along with enhancing the ability to gain insight in to tracked activities and compare similar activities side by side.
Impact
Rapidly build out an insightful app through SaaS with the objective of visualising, analysing and understanding my activity tracker data in a more intuitive and flexible manor, beyond the functionality the tracker vendor or 3rd party provided analytics functions.
Audience
The audience for this app was me personally
Data and advanced analytics
The data and analytics within this app has provided me with the ability to compare similar activities in order to understand effort, performance and time improvement through my training program.
-
Welcome to our new Educator Ambassador, Sumitra Pundlik!
I feel pleased to introduce our new Educator Ambassador for 2023, Sumitra Pundlik from MIT ADT University, Pune, India. Sumitra is an Educator since ... Show MoreI feel pleased to introduce our new Educator Ambassador for 2023, Sumitra Pundlik from MIT ADT University, Pune, India. Sumitra is an Educator since the last 14 years and is currently working as a Senior Assistant Professor at MIT ADT University. She is the Specialization Head Coordinator for Data Analytics and overlooks the curriculum design.
Sumitra teaches various subjects related to Data Analytics such as DBMS, Advanced DBMS, Machine Learning, Big Data Analytics. She has also taught R and Python Programming including different BI and visualization technologies including Qlik Sense.
Sumitra has been a member of the Qlik Academic Program since the last two years and has also successfully earned the Qlik Sense Business Analyst Qualification. After earning this qualification, she supported the learning journey of more than 50 students and encouraged them to pursue Qlik Sense Business Analyst Qualifications.
According to her, “The Qlik Academic Program provides a great opportunity for students to access many online resources and different qualifications and certifications including Data Literacy, Qlik Sense Business Analyst and Qlik Sense Data Architect. The interactive material of the academic program helps students to excel in the field of data analytics”.
A landmark step has been the inclusion of Qlik in the data analytics specialization within the curriculum of the Information Technology Department, MIT School of Computing at MIT ADT University. This specialization is designed to enable students to become a qualified data analyst. According to Sumitra, there's a tremendous demand for such specializations among graduates and they are eager to acquire specialized courses for future opportunities.
“We are leveraging resources from the Qlik Academic Program for second year engineering students as a part of their data visualization course and third year engineering as a part of their data analytics course. Along with this, we are encouraging students from other disciplines to become a part of the Qlik academic program” according to Sumitra.
Further she adds, “I have been spreading awareness about the Qlik Academic Program and its benefits to other engineering colleges by conducting expert sessions via social media platforms”
Sumitra says, “Moving ahead, we are keen for internship and job opportunities for our students who have a good understanding of Qlik Sense and have earned the academic program qualifications.”
In Sumitra’s words, “Data literacy is my interest and I want to educate every data science enthusiast about the importance of data literacy.”
She feels it’s her mission to create more awareness about data analytics and encourage use of Qlik Sense. Data is the new fuel, and it is driving the current industry, she further adds.
Looking ahead, she endeavors to become part of the 2024 Qlik Academic Ambassador Program!
When Sumitra is not teaching, she likes spending time with her son, Viraj. She is focusing on upskilling herself in recent trends, also taking care of her health and following a workout routine.
We are looking forward to working closely with Sumitra during her tenure as an ambassador and creating more links with Universities in Pune and rest of India.
For more information about our Ambassador Program, please visit: qlik.com/us/company/academic-program/ambassadors
Educators and students looking for free analytics software and training can apply to the Academic Program by visiting qlik.com/us/company/academic-program
-
Bring your own encryption keys to Qlik Cloud with Customer Managed Keys
As industries transition into cloud infrastructures, each face their own unique regional or regulatory requirements around data protection and privacy... Show MoreAs industries transition into cloud infrastructures, each face their own unique regional or regulatory requirements around data protection and privacy such as GDPR in Europe or HIPAA for US Healthcare. It’s critical that enterprises can trust their data being safe when deployed into the cloud. A vital component of that security infrastructure is through enhanced data encryption and leveraging cryptographic keys.
For customers with higher security requirements, we have released Customer Managed Keys, an additional security offering allowing customers to bring their own encryption service to Qlik Cloud. This empowers the customer to retain full control over their data’s encryption key. If the customer disables access to the encryption key, Qlik Cloud can no longer access the data in that tenant. It’s your data, and your encryption keys.
What is Customer Managed Keys?
Customer Managed Keys is a new security offering in Qlik Cloud which allows customers to bring their own encryption keys (BYOK) to protect the data stored at rest in their Qlik Cloud tenant.
Additional control around data access
Customers may have sensitive data that they do not want Qlik to manage on their own. Customer Managed Keys ensures only the customer has access to the data – not Qlik. If data is encrypted using customer-managed keys and the customer disables access to the encryption key, it is technically impossible for Qlik to decrypt the data without the customer’s consent. The customer keeps full control over the data’s lifecycle.
Qlik’s first implementation of Customer Managed Keys will use AWS Key Management Service (AWS KMS). AWS KMS is a managed service that makes it easy to create and control the cryptographic keys that are used to protect your data. AWS KMS uses hardware security modules (HSM) to protect and validate your AWS KMS keys under FIPS 140-2.
Technical Diagram of integration with AWS KMS
Summary
We strive to support our customers navigation through complex regulatory landscapes and enable them to tailor a data security strategy that meets their needs. Customer Managed Keys brings that extra level of trust and security for customers with sensitive data moving in to Qlik Cloud.
To watch a walk-through video, see here.
To learn more about deploying Customer Managed Keys in your Qlik Cloud tenant, see here
-
Get Started with Qlik today!
Join us for the upcoming free, live Introduction to Qlik Continuous Classroom webinars and learn what resources are avalible for you to get started wi... Show MoreJoin us for the upcoming free, live Introduction to Qlik Continuous Classroom webinars and learn what resources are avalible for you to get started with Qlik or get ready to sit for a Qualification exam!
This introductory webinar will explore the Qlik Continuous Classroom and the different ways to locate and access content. With over 300 courses, personalized learning plans and qualifications, let us help you get started and become familiar with all the Qlik Continuous Classroom has to offer!
Host: Kristina Parks
Language: English
Session duration: 45 minutesUpcoming webinar times don't work for you? Register to receive the on-demand recording.

-
Renaming Fields with a Mapping Table
Is there a way to rename several field names in table all at once? This is a question I recently asked myself while building a data model. I was build... Show MoreIs there a way to rename several field names in table all at once? This is a question I recently asked myself while building a data model. I was building an app to explore various datasets and one of the source files included a CSV file that had over 300 fields. Most of the fields were codes used to describe a metric. I also had a key or definition table that provided a description for all the codes. Below is a small fictional example of the type of data included in the files.
Data Dictionary file example:
Data file example:
The data file was the file that had over 300 codes for the field names. Of course, I can rename fields in the script using “as” in my load script like this:
This is what I would normally do to rename fields in my data model, but when I have over 300 fields in a single table, this can be cumbersome. I use mapping tables all the time to normalize/update/scramble data in a field, but I did not know mapping tables could be used to also rename fields in a table. Here is the syntax to do this (Qlik Help).
Rename Field (using mapname | oldname to newname{ , oldname to newname })
Rename Fields (using mapname | oldname to newname{ , oldname to newname })Depending on how many fields you are renaming, you use Rename Field or Rename Fields. One option is to use a map that was previously loaded using the Mapping Load syntax. The other option is to list the old name and new name as parameters in the script function. Since I have a file with all the codes and descriptions, I will use a mapping table in this function. In the script below, I load the data dictionary mapping table named DataDictionaryMap and then I load the Data table. To keep things simple in this example, the Data table only has 4 fields with code field names, but imagine there are over 300 fields with code field names. The last step is to rename the fields using the Rename Fields function using the DataDictionaryMap I created.
A preview of the Data table, as shown below, displays the new field names that use the code description. Instead of renaming each field individually, I used the Rename Fields script function along with a mapping table, to rename all the field names that were included in the map. Fields that are not in the map, remain the same with no change. Note that whenever you rename fields, you want to make sure there are no fields with the same name.
It is funny how I have used mapping tables and the rename table function all these years without coming across the rename fields function using a mapping table. Nonetheless, I love it when I learn something new so hopefully, you find this helpful.
Thanks,
Jennell
-
【オンデマンド配信】サプライチェーンの混乱とリアルタイムデータの融合
新型コロナウイルスの世界的流行やウクライナ紛争は、世界的なサプライチェーンに悪影響を及ぼし続けています。企業や個人消費者も、在庫不足・出荷遅延・価格高騰に絶え間ないストレスを感じています。 リアルタイムのデータを処理するインフラは以前からありますが、サプライチェーンの障壁を早期に特定し、障害が発生... Show More新型コロナウイルスの世界的流行やウクライナ紛争は、世界的なサプライチェーンに悪影響を及ぼし続けています。企業や個人消費者も、在庫不足・出荷遅延・価格高騰に絶え間ないストレスを感じています。
リアルタイムのデータを処理するインフラは以前からありますが、サプライチェーンの障壁を早期に特定し、障害が発生する前にリソースを補てん・移行することが、これまで以上に求められています。Qlik は、企業がデータを提供するパイプラインの可能性を最大化するソリューションで、課題の解決を支援します。
サプライチェーンの重要な課題にスマートかつタイムリーに対応するには?Qlik グローバルマーケットインテリジェンス シニアディレクターの Dan Sommer と、SDI 社 デジタルサプライチェーン変革部門 ディレクターの John Delligatti 氏が議論します。アラート機能で潜在的な課題に先手を打ち、不測の事態に対する強力な対応計画を実行してビジネスチャンスを捉える方法をご紹介します。
※ 参加費無料。パソコン・タブレット・スマートフォンで、どこからでもご視聴いただけます。日本語字幕付きでお届けします。
- デジタルコントロールチームの構築とデータ主導の業務改善
- リアルタイムの通知で、データを行動につながるインサイトヘ変換
- 自動化による業務の効率化とベテラン労働者不足の緩和
- データストーリーの共有で、説得力を強化
-
QlikWorld 2023 is Carbon Neutral!!
QlikWorld 2023 is Sustainable! This year QlikWorld will be a sustainable and carbon-neutral event!! Qlik has partnered with Climate Vault to include C... Show MoreQlikWorld 2023 is Sustainable!
This year QlikWorld will be a sustainable and carbon-neutral event!! Qlik has partnered with Climate Vault to include CO2e emissions from the QlikWorld 2023 event in overall reduction strategies as a leader in the fight against climate change. Qlik is committed to reducing water, energy, and waste to support our path to Net Zero CO2e emissions. Following this commitment, QlikWorld will be zero waste, donate all leftover food, focus on using reusable materials, and more! See more details in this blog.
One of the brightest areas of progress and an exciting trend is what’s happening with venues, who are taking their local footprint/impact and need to be more sustainable seriously. The QlikWorld team is partnering with our venue host Mandalay Bay so we can partner in designing an event with the goal of being carbon neutral. MGM Resorts has opened a Mega Solar array and announced to source 100% of renewable electricity in the US by 2030!
-
Connector Factory – March 2023 Releases
Connector Factory March Release Update: Enhanced connectors: Google BigQuery and MongoDB Qlik has expanded the capabilities of our Google BigQuery and... Show MoreConnector Factory March Release Update:
Enhanced connectors: Google BigQuery and MongoDB
Qlik has expanded the capabilities of our Google BigQuery and MongoDB connectors by providing the option for personal connections when accessing these repositories. Similar to our other enterprise connectors within Qlik Cloud Analytic (ex. Snowflake, Salesforce, Oracle, etc.), customers can now define user-specific credentials instead of the generic company identifications when connecting to Google BigQuery and MongoDB. Users can also save these credentials so they can be reused across multiple connection definitions to the same source.New connector: SFTP
Qlik Cloud Analytics now includes a SFTP connector that will enable you to download files from, or upload to, secure FTP locations. SFTP (SSH File Transfer Protocol) is a secure file transfer protocol that runs over the SSH protocol and can help enterprises meet HIPAA, GDPR and other regulatory rulings for file transfer compliance. Similar to other Qlik Cloud Analytics file-related connectors (SharePoint, Google Drive, Dropbox, etc.), users can also use this SFTP connector to browse and drill into any folder the user has access to on the SFTP server.Enhanced connectors: Azure SQL database and Azure Synapse Analytics
The Azure SQL database and Azure Synapse Analytics connectors now support two new authentication methods to enable a more secure authorization technique when accessing these repositories:
• The Azure OAuth method allows for single sign-on (SSO) when using the OAuth token-based authentication process
• The Azure Active Directory can be used to protect user identity and simplify the sign-in experience -
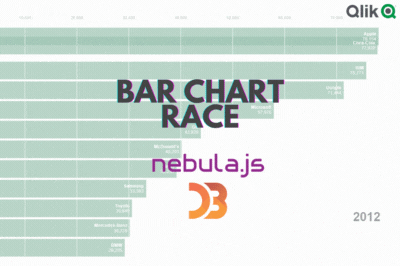
Using Nebula.js & D3.js to build a visualization extension for Qlik Sense: Bar C...
In my previous blog post, I talked about how custom visualization extensions enable you to go beyond the default visualization capabilities of Qlik Se... Show MoreIn my previous blog post, I talked about how custom visualization extensions enable you to go beyond the default visualization capabilities of Qlik Sense and we took a look at how to create a custom Stream Chart using Qlik’s Nebula.js and Picasso.js.
Sometimes however, you might find yourself wanting to build more complex charts that can be difficult to do using only what the Picasso.js library has to offer.
In this blog post, we will do just that as we build a cool Racing Bar Chart visualization using D3.js that we will then package and upload to our Qlik Cloud tenant.
First, let’s talk about what a Bar Chart Race visualization is and where you can use it to enhance your data storytelling:
A bar chart race is a type of data visualization that displays changes in data over time using dynamic animated bars. It’s often used to show the ranking or position of different groups or categories over a period of time.
In a bar chart race, the bars representing each group/category move horizontally or vertically to show the changes in their values over time. The length of the bars represents the magnitude of the data being visualized.
This type of chart is particularly effective in visualizing data that is dynamic and changes frequently. It can be used to compare different categories or groups in terms of their performance, popularity, or other factors over time. Bar chart races are also visually engaging, making them a popular tool for sharing data on social media and other platforms.
Some examples of usage include:
- Comparing sales data for different products or services
- Showing the distribution of income levels across a population
- Visualizing the frequency of different types of crimes in a city or region
- Monitoring the spread of a virus across countries
- Comparing the popularity of different social media platforms over time
Project setup
If you are new to creating visualization extensions in Qlik Sense, you might want to go through my previous blog post or check out these resources as I’m not going to cover all the details here.
- Run the following command to bootstrap the codebase (notice that we used the “—picasso none” to prevent the generation of a picasso.js template)'
npx @nebula.js/cli create racing-bar-chart --picasso none - Next, move into the newly created project directory and run the following commands (1st one to install D3.js, and 2nd one to run our project)
This will open the Nebula.js dev UI, follow the instructions to connect to your Qlik Cloud tenant:npm i d3@6.0.0 --save npm run start - Enter the websocket URL which includes the “web integration id” and is formatted like this:
wss://YOUR_TENANT.us.qlikcloud.com/&qlik-web-integration-id=YOUR_WEBINTEGRATION_ID
P.S: to get your web integration id, go to your Qlik Management Console, click on “Web” on the left sidebar, then click on “Create new"
- Next, select the Qlik Sense App from the list (The QVF with data is attached to this post)
- Back to the code base, we need to edit the configuration files to define the data structure as follow:
- object-properties.js:
const properties = { showTitles: true, title: "", subtitle: "", footnote: "", qHyperCubeDef: { qDimensions: [], qMeasures: [], qInitialDataFetch: [ { qWidth: 3, qHeight: 3300, }, ], }, }; export default properties; - data.js:
export default {
  targets: [
    {
      path: "/qHyperCubeDef",
      dimensions: {
        min: 1,
      },
      measures: {
        min: 1,
      },
    },
  ],
};
- object-properties.js:
Since we’re going to view Brand Value over time for Companies, we need 1 measure (sum(value)) and 2 dimensions (Date and Name).
- You can now select these 2 dimensions and 1 measure in the Nebula.js dev UI on your browser:
Developing the visualization in Nebula.js and D3.js:
For the purposes of keeping this post short, we’re not going to dive deep into the details of the D3.js code. You can visit this comprehensive post by the co-creator of Observable and main developer of this library, that explains in detail the implementation of this chart.
- index.js:
This is the main entry of our extension and contains our Nebula.js code.
Note that we’re using a few hooks from the imported @nebula.js/stardust package which should be familiar if you’re used to developing React.js applications.
- useElement provides the HTML element where we attach our visualization.
- useLayout is used to get the layout of our generic object (hypercube).
- useEffect is used to run the callback function we pass it when certain values change.
- useState helps keep track of state within the application. In this case we use it to replay the animation.
- vis.js:
This is where all the magic happens and where the D3.js specific code lives. For brevity, I will highlight the important parts of this file:
1: constants needed in calculating d3 scales and positionning.
2: D3 scales with x being a linear scale and y being a band scale
3: Data derived from the source data (gets passed on index.js)
4: Helper functions including rank() function to compute brand ranks, and keyframes() to compute interpolate values within each year for a smooth animation.
5: D3 formatting functions
6: D3 drawing functions for the components that make up the visualization:
- Bars
- x-axis
- labels (on each bar)
- ticker (Date)
7: D3 animation that iterates over each keyframe and updates the components above.
Finally, to build the extension, run:
npm run buildAnd in order to package the extension for Qlik Sense, run: (make sure to zip the folder in /dist before uploading it to your tenant)
npm run sense-------------------------------
Source Code on Github: https://github.com/ouadie-limouni/Qlik-Nebula-Bar-Chart-Race-Viz-Extension
Zipped Extension: Attached
QVF: Attached
-
Qlik Data Integration Client Managed Releases in February 2023
February is traditionally the month to show you care about somebody you love, and this month we continue to give some love to our Qlik Data Integratio... Show MoreFebruary is traditionally the month to show you care about somebody you love, and this month we continue to give some love to our Qlik Data Integration Client-Managed portfolio with a round of several releases, mainly through our regular scheduled Service Releases. As a reminder for our client-managed portfolio, we currently have an annual release cadence of two main GA releases, and generally two Service Releases, and in between patches can be released on an as-needed basis.
Here is a round-up of some of the highlights of what's new.
Qlik Replicate November 2022 Service Release 1
In this release of Qlik Replicate, we have made some improvements and enhancements around source and target endpoints.
Support 4-byte Replication into Cloud targets from Oracle source
We have removed a previous limitation by adding support for replicating data with 4-byte emoji characters, from an Oracle source into various cloud targets:
- Snowflake
- Databricks
- Azure Synapse
- Google Big Query
Databricks as a Target
Continuing with our strong working partnership with Databricks we have added support for Databricks (Cloud Storage) and Databricks Lakehouse (Delta) 11.3 LTS
Qlik Compose May 2022 Service Release 2
Databricks Unity Catalog integration
Until now Qlik Compose did not integrate with Databricks’ Unity Catalog. With this release, you can define and configure a Unity Catalog as the target for Qlik Compose tasks. Qlik Compose users can utilize a three-part naming convention to register generated Delta tables and Live views. Qlik users then get the benefits of the Unity Catalog, such as role-based access control, lineage, and more, as they consume the registered data.
Engineers using Qlik Replicate to write non-Delta formats would require the hive_metastore catalog as a target. Qlik Compose reads metadata and data from the hive_metastore catalog and then creates and processes data to delta tables in the target Unity Catalog. Qlik Compose users can streamline this multi-step process once Unity Catalog supports partitioned external tables in non-Delta formats.
Performance and cost improvement
Before, Qlik Compose did not skip the subsequent SQL execution steps that used a table with no rows loaded into it as part of data movement or transformation. Now, with this release, Qlik Compose culls groups of hundreds of SQL execution steps when not required, based on run time metadata. This helps to reduce execution time and further improves the suitability for low-latency use cases. This capability is available in both Snowflake and Microsoft Synapse.
Enhanced security and governance
In the past, Qlik Compose Synapse projects created all dimension and fact tables within a single schema as part of the data mart configuration, with dependent views created in different schemas. With this release, you can configure physical data mart tables in different schemas with Qlik Compose – you can have the finance data mart in the finance schema, the revenue data mart in the revenue schema, and so on.
This fine-grained control will allow the data warehouse administrators to separate the different artifacts, leading to higher security. Also, administrators can provide user permissions at the schema level rather than an at an individual table or view level, simplifying administration.
This capability was previously available for Snowflake and Microsoft SQL Server and is now available for Microsoft Synapse.
Command Line interface improvements
Based on customer feedback, we have improved how Qlik Compose users can update custom-SQL within pre-load, intermediate and post-load steps for data warehouse and data mart automation. With this release, you can now revise these steps using the command line interface rather than having to rely on the user interface, which customers have informed us was not as time efficient as it could be. Custom-SQL can be written in files to update multiple development and CI/CD environments helping to reduce time to production.
Qlik Catalog February 2023 Client-managed
Schedule load jobs via properties - This release for Qlik Catalog builds upon the data load scheduling capability that was introduced in the November 2022 release. Users can now define these schedules via properties in the source connector object.
Modify publish job datasets - Previously, once a dataset was defined during the publishing job creation process, it could not be changed. The user now has the ability to subsequently modify the dataset.
Expanded support for PowerBI - Qlik Catalog already supports the publishing of data to Microsoft PowerBI Pro and Premium. In this release, we have added support for Microsoft GCC (Government Community Cloud).
We hope you enjoy using Qlik Data Integration products and would love to hear your feedback and success stories, especially in any improvement gains you achieve.
To learn more, please visit the Downloads and Release Notes section on Qlik Community
Release notes are available here
To obtain any of these releases, go to Qlik Downloads in the community and filter “Category” by “Qlik Data Integration”, and then select the product and the versions you would like to download.
Note: For most products, selecting “Latest release and patch” under the “Release Assets” by should be enough.
If required you can filter further by selecting the latest Service Release (SR) version under “Release Number”.
For additional help in using the downloads site - watch this handy video guide here:
How-to-download-Qlik-Products -
Start with a New User Learning Plan for Free!
Are you a NEW USER looking for a place to start learning or an experienced user needing guidance on the NEXT STEPS in your learning journey, our learn... Show MoreAre you a NEW USER looking for a place to start learning or an experienced user needing guidance on the NEXT STEPS in your learning journey, our learning plans will get you where you need to go.
Our targeted, prescriptive learning plans are perfect way to get started. The New user plans are free! Access learning Plans and take the guesswork out of what to do next in your learning journey.
Once you complete all courses in one of the New User Learning Plans, Earn your Achievements Badge. Happy Learning!
-
Attending QlikWorld? Register for your 1st Certification Exam for Free!
Every QlikWorld attendee can register for 1 (one) exam for free! Any additional certification exams are discounted to $100. To receive your free cert... Show MoreEvery QlikWorld attendee can register for 1 (one) exam for free! Any additional certification exams are discounted to $100. To receive your free certification exam or to register for additional exams, please complete the steps below:
- Refer to the Free Certification section on the QlikWorld site for the free exam voucher code
- Visit https://home.pearsonvue.com/qlik/qlikworld (QlikWorld discounts are only available via this link)
- Click ‘Register for your exam’
- Select which Qlik certification exam you wish to register for
- When asked where you want to take your exam, select ‘At a test center’
- Select your date and time from the available appointments
- On the check-out page, click ‘Add Voucher or Promo Code’ and enter the voucher code found on the QlikWorld site.
- Additional exams are discounted to $100, no voucher code needed.
Appointments are limited. All exams must be taken on-site during QlikWorld April 17-20 to receive the discounts.
Contact certification@qlik.com for questions!
-
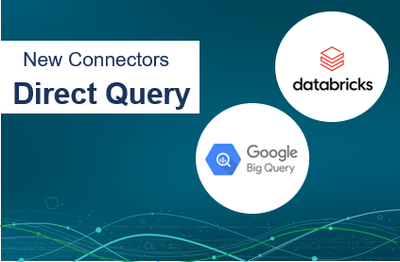
Databricks and Google BigQuery available for Direct Query in Qlik Sense SaaS!
Now users can connect to Google BigQuery and Databricks databases using Direct Query in Qlik Sense SaaS. Direct Query provides the ability for analyti... Show MoreNow users can connect to Google BigQuery and Databricks databases using Direct Query in Qlik Sense SaaS. Direct Query provides the ability for analytics applications to directly query cloud databases with SQL pushdown as users interact with data through visualizations and easy filtering. Direct Query allows developers to build SQL-centric applications for big data analysis or near real-time scenarios.
Direct Query complements our best-in-class analytics engine and extends the range of consumption techniques for data discovery and analyzing data from cloud databases.
As of the date of this publication, Qlik has released the following connector for Direct Query:
- Snowflake
- Databricks
- Google BigQuery
To learn more about Direct Query, check out this blog and documentation here.
For more in-depth overview, see:
-
Welcome to our new Educator Ambassador, Dorina Kabakchieve!
Dorina is Associated Professor at the Department of Information Technologies and Communication, at the University of National and World Economy (UNWE)... Show MoreDorina is Associated Professor at the Department of Information Technologies and Communication, at the University of National and World Economy (UNWE). Dorina lives in Sofia, Bulgaria, with her husband while her two children study at university in the Netherlands. She has been using Qlik in her teaching for 10 years, in the Business Intelligence and Data Mining fields. She also works on many other projects (European and national) in the ICT field, both managing and doing research.
Dorina was inspired to use Qlik after attending a workshop, “The training was organized by a Bulgarian company – Balkan Services, implementing QlikView software in Bulgarian companies. During the workshop, I spoke with the company representatives about the opportunities for using QlikView at the University and they supported me. That is how our long-term collaboration started and continues.”
“I am using the software and the provided resources in my classes in the Business Intelligence courses for BSc and MSc students. I have defined assignments aimed at teaching the software functionalities, as well as use cases - for creating BI applications based on business data. The students use the software also to develop their bachelor and master theses.”
Using Qlik in the classroom has helped some of Dorina’s students secure jobs after graduation, she says “there are students who have participated in my courses and later on informed me, or I met them at events, that they have taken the position of BI consultants in companies. Some of the students have joined the BI teams of famous international companies, and others work for smaller companies. As the years pass by, some of those people have further developed their careers and took managerial positions related to BI.”
Dorina wanted to become an Educator Ambassador to expand her network and establish new relations with other university colleagues and business professionals.” I would be grateful to exchange ideas and experience, in order to implement new approaches, teaching methods and interesting activities in my classes. The involvement of business professionals in the teaching process and the more active collaboration with the business are also goals that are in my focus.”
When she isn’t teaching Dorina loves to hike in the beautiful Bulgarian mountains, every week she walks in Vitosha mountain which is 15 min away from Sofia. She also likes reading, going to the theatre, practicing yoga and cooking. When she has time off she loves to travel within Bulgaria because of its beautiful nature, as well as visiting some of her favorite countries in Europe - Spain, Italy and Greece. In the past few years she has also made trips to parts of Asia and the USA.
If you'd like to learn more about how you can get access to free software and training resources to use in your teaching, follow this link for more information: qlik.com/academicprogram
-
One Day Left for QlikWorld Super Savings - Register Now!
Register Now - $200 Savings Ends Tomorrow! QlikWorld is a Month Away! Check Out the QlikWorld Speaker Lineup Emcee: Katie Linendoll, Emmy... Show MoreRegister Now - $200 Savings Ends Tomorrow!
QlikWorld is a Month Away! Check Out the QlikWorld Speaker Lineup
100+ Breakout Sessions. 5 Workshops. 8 Certifications. Unlimited knowledge. Check out the online session guide >
Don’t miss out. Register today.
-
【オンデマンド配信】データファブリックで時間短縮とコスト削減を実現
データファブリックは、なぜ重要なのか? 多くの企業が同様の課題に直面しています。膨大なデータが至る所に分散し、異なるアクセスレベルがデータへのアクセスを妨げているため、データから迅速に行動につながる有益なインサイトを獲得することができていません。 この課題を解決するのが「データファブリック」です。... Show Moreデータファブリックは、なぜ重要なのか?
多くの企業が同様の課題に直面しています。膨大なデータが至る所に分散し、異なるアクセスレベルがデータへのアクセスを妨げているため、データから迅速に行動につながる有益なインサイトを獲得することができていません。
この課題を解決するのが「データファブリック」です。俊敏性と拡張性を備えたデータファブリックは、今日のデータ管理の進化にリアルタイムで対応するアーキテクチャの構築を支援します。
GigaOm 社 リサーチディレクターの Andrew Brust 氏と、Qlik 製品マーケティング部門 副社長の Dan Potter が、データファブリックの仕組みや考慮すべき成功要因、導入を成功に導くデータ統合の重要な役割をご説明します。
※ 参加費無料。パソコン・タブレット・スマートフォンで、どこからでもご視聴いただけます。日本語字幕付きでお届けします。
- データファブリックの概要
- データファブリックを使用すべき理由
- 考慮すべきリスク
- ユースケースとシナリオ
- コストと価値創出までの時間
- 30 / 60 / 90日導入計画
-
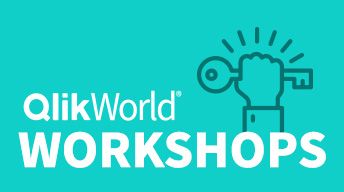
Register for Hands-on Workshops at QlikWorld Today!
Take Your Career to the Next Level at QlikWorld. Register for Hands-on Workshops Today! 10+ hours of roll up your sleeves, immersive working sessions.... Show MoreTake Your Career to the Next Level at QlikWorld. Register for Hands-on Workshops Today!
10+ hours of roll up your sleeves, immersive working sessions. Learn technical best practices on how to implement and optimize Qlik Products and Solutions.
*A $1000 value included in conference pass!
Space is limited, seats are filling fast! Register now!
How to Register for Workshops at QlikWorld:
- Log in to the breakout catalog
- Filter by Session Type, Hands-on Workshop
- Click the “+” button to register and add them to your customizable schedule
Technical Workshops:
Introduction to Qlik AutoML Hands-On Workshop
Qlik Cloud Data Integration Hands-On Workshop
Qlik Cloud Embedded Analytics Hands-On Workshop
Migrating to Qlik Cloud Hands-On Workshop
Build And Create A Simple Data Pipeline With Talend Studio Hands-On Workshop
SaaS Data Integration And Data Quality Hands-On Workshop
*IMPORTANT - Registration required and participation requires that you bring your own device (BYOD). Laptop recommended.