Unlock a world of possibilities! Login now and discover the exclusive benefits awaiting you.
Analytics & AI
Forums for Qlik Analytic solutions. Ask questions, join discussions, find solutions, and access documentation and resources.
Data Integration & Quality
Forums for Qlik Data Integration solutions. Ask questions, join discussions, find solutions, and access documentation and resources
Explore Qlik Gallery
Qlik Gallery is meant to encourage Qlikkies everywhere to share their progress – from a first Qlik app – to a favorite Qlik app – and everything in-between.
Qlik Community
Get started on Qlik Community, find How-To documents, and join general non-product related discussions.
Qlik Resources
Direct links to other resources within the Qlik ecosystem. We suggest you bookmark this page.
Qlik Academic Program
Qlik gives qualified university students, educators, and researchers free Qlik software and resources to prepare students for the data-driven workplace.
Recent Blog Posts
-
Traffic Accidents in Brazil
Traffic Accidents in Brazil Hyperscale This dashboard was developed with the aim of studying the new layout Container and design possibilities i... Show MoreTraffic Accidents in BrazilHyperscale This dashboard was developed with the aim of studying the new layout Container and design possibilities it offers. The data used originated from a survey of accidents on federal highways in Brazil.
Discoveries
Types of accidents most common on Brazilian highways, which highways are the most dangerous and require an action plan to reduce accidents, the times and days with the highest occurrence of accidents.
Impact
Mapping the most dangerous highways for a future action plan to reduce accidents, monitoring the most critical times on the roads.
Audience
Traffic enforcement agencies, municipalities, and states
Data and advanced analytics
Ease of visibility of Brazilian highways and comparison between states and highways.
-
Welcome back Angelika Klidas - Qlik Educator Ambassador Class of 2024!
This week we would like to introduce Angelika Klidas, who happens to be a returning Educator Ambassador. We are excited to select Angelika as an Amba... Show MoreThis week we would like to introduce Angelika Klidas, who happens to be a returning Educator Ambassador. We are excited to select Angelika as an Ambassador for the 3rd year in a row due to her continued enthusiasm for Qlik’s Academic Program and her efforts in 2023.
Angelika’s journey with Qlik began in 2008 when she started out installing and managing a successful QlikView Competence Center as a team manager of the team for a Governmental Organization in the Netherlands. Since then, she has always been a huge Qlik Advocate in both her day job and her university teaching. Angelika works currently as an Advisor & Trainer and the Business Data Challengers and is responsible for the BDC Academy, sales and account management along with some innovative work! She also teaches Data and Analytics at the University of Applied Sciences in Amsterdam which is her part time role. She is a conceptual thinker who lives by the phrase “think big, act small, and scale fast” which she uses to inspire others to evolve in their use of data and analytics.
In 2022, Angelika began writing a book together with Qlik’s Chief Learning Officer Kevin Hanegan about Data Literacy. The book was formally launched on the 30th of November 2022 and is called “Data Literacy in Practice”. The book is available through Amazon.com and Packt.com.
Angelika applied to become a Educator Ambassador with the Qlik Academic Program as she is passionate about educating students in data analytics and championing the cause of Data & AI Literacy. Due to the change in situation in the field of education, she included new aspects in her teaching style which include setting up training materials “how to use Qlik Sense from an analysis perspective so that students know and understand the full power of Qlik Sense, using AHA Slides (to make the lectures more interactive) and the book “Data Literacy in Practice”. Her book is now also a mandatory book for the University. With the help of the techniques from the book and learning to work with Qlik Sense helps her students not only to analyze the data in a better manner but also how to help organizations form a data strategy, develop organizational KPI’s and build amazing dashboards & reports.
Angelika is proud of the fact that she is the Qlik Academic Program Ambassador and has included the Educator Ambassador badge, mentioned it on her resume and highlights it in her presentations! This year again she is presenting twice at Qlik Connect and is also a Panelist for around the topic ethical handling of data.
In Angelika’s words, “I love the power of grey, love the academic program and the great benefit that it gives to me and my students. My students can pursue their dreams when they would like to work in data and analytics .” She is excited about the fact that some of her students got a job in the data and analytics world, which is amazing! An interesting fact is that since 2008, 34% of her 295 students are working in the field of data and analytics. Her main goal for 2024 is to work on new training materials for Data & AI Literacy in Dutch and English. Angelika has developed several Generative AI trainings that help people (at school and in her commercial work field) to use the Gen AI tools, but also she trains them to question the outcome. Questioning the results, either from insights that we create or the results that we get from the Gen AI tools we use is mega important. Next to that Angelika has developed a “Serious Data Training” where she combines a the first basic concepts of Data & AI Literacy, a Data Escape Room and a session of reflecting on the soft skills that people need during the process of data informed decisions.
Angelika feels that more and more organizations are now emphasizing the importance of Data & AI Literacy. She loves to work with the four pillar system which should be the basis of every organizations journey towards “Active Intelligence” so they will be future ready!
In Angelika’s words, “I love the Qlik Academic Program, it helps the students in gaining analytics knowledge for my students. They can learn at their own pace and look for solutions through the learning platform, but also use the knowledge from the community and demos.qlik.com where they can find all kinds of cool solutions”
We are looking forward to working closely with Angelika during her tenure as an ambassador yet again and creating more links with Universities in the Netherlands.
For more information about our Ambassador Program, please visit: qlik.com/us/company/academic-program/ambassadors
-
Reporting Service Packaging Changes
Qlik Cloud Reporting packaging changes are here! We’ll be replacing the multiple tiers with simple ‘Small and Large Add-On Packs’, alongside standardi... Show MoreQlik Cloud Reporting packaging changes are here!
We’ll be replacing the multiple tiers with simple ‘Small and Large Add-On Packs’, alongside standardized limits for easier management.
Our new Standard, Premium and Enterprise customers using our Capacity Model, will have reporting entitlements included in their package. Customers on our User Based Model will have 1000 reports included and available to them.
All customers can purchase our add-on packages when needed.
See structure below:
Key: QSE = Qlik Sense Enterprise / QCA = Qlik Cloud Analytics
Items to Note:- Depending on your product package, you will be automatically placed in the standardized limits above. Those who already have paid tiers will continue-on their current tier until their contract ends.
- If you’re expecting to exceed your standard limit, be sure to contact sales to purchase our add-on packages to prevent future overages.
Additional Resources:Product Descriptions for Qlik Cloud Subscriptions | Qlik Resources
Reporting Services | Product Innovation Blog
Reporting from Qlik Cloud Analytics | Qlik Help Page
Tabular Reporting Corporate Blog -
Qlik Cloud 3月の新機能
分析の新機能 管理スペースでの表形式レポート 管理スペースで公開されたアプリケーションに対して、表形式レポートタスクを開発・設定できるようになりました。Microsoft Excel用のQlikアドインは、管理スペース内のアプリケーションに接続できるようになっています。 テンプレートはアプリの公開... Show More分析の新機能
管理スペースでの表形式レポート
管理スペースで公開されたアプリケーションに対して、表形式レポートタスクを開発・設定できるようになりました。Microsoft Excel用のQlikアドインは、管理スペース内のアプリケーションに接続できるようになっています。
- テンプレートはアプリの公開前でも公開後でも開発可能です。公開前に作成した場合は、公開後にアドインの接続アプリを変更してください。
- 配布リストは公開前にアプリに追加する必要があります。配布リストの更新にスペースを考慮したスクリプト構文を使用してください。
- レポーティングタスクの他のすべてのタスク要素は、管理スペースで作成できます。
シートナビゲーションの位置変更
アプリの「シートヘッダーを表示」をオフにした場合の、シートナビゲーションの位置が変更になりました。
その他
- 階層構造の Parquet ファイルのStoreにフォーマット指定子が追加されました。[Delimiter is] 指定子を使用すると、単一テーブルをネスト モードで保存することもできます。
- AutoMLの実験に使用したデータセットをカタログから変更、更新できるようになりました。
- データ接続 API が更新されました。すべての分析データソースに対する直接接続、ゲートウェイー直接アクセス経由の接続をサポートします。
- アプリの自動化において、Triggered と Webhook のフローは最大14日間キューに保存され、実行されない場合はキューから削除されて、ステータスは失敗となります。
データ統合の新機能
様々な機能強化
これらの機能強化を利用するためには、Qlik Data Gateway - Data Movement 2023.11.4 以降が必要です。
- Red Hat 9.xへのデータ移動ゲートウェイのインストールをサポート
- データ移動ゲートウェイのサービスの停止、開始、ステータスチェックのコマンドの変更
- Amazon Redshift で VARCHAR(1) にマッピングされていたBOOLEANのデータ型は BOOLEAN に、BYTES、BLOBのデータ型は VARBINARY にマッピングするよう変更
- 新しくサポートするデータベース、データベースバージョン、ドライバーバージョン
- データソース
- Azure Database for MySQL - フレキシブル サーバー (MySQL ソースコネクタ経由)
- MariaDB 10.4 - 10.11 (以前は 10.4 and 10.5)
- ターゲット
- Azure Database for MySQL -フレキシブル サーバー (MySQL source connector 経由)
- Databricks: Databricks 13.3 LTS 、 Serverless SQL Warehouse
- SAP HANAドライバのバージョン
- Red Hat Linux 9.xにData 移動ゲートウェイをインストールしたいSAP HANAソースを持つお客様は、SAP HANA ODBC 64-bit Driverバージョン2.0.19以降をインストールする必要があります。
- 下記のデータソースはサポートを終了します。
- Oracle 11.x
- SAP HANA 1.0
- データソース
物理オブジェクトとデータプレビュー
データ統合で、データセットを構成する基礎となる物理オブジェクトを表示することができるようになりました。また、物理オブジェクトのデータサンプルもみることができるようになりました。フィルタリングで表示範囲を絞ることもできます。SQL変換の結果を直接プレビューすることもできます。
あらかじめ、管理コンソールの「機能コントロール」>「データ統合でデータを表示」をオンにする必要があります。またデータ接続のあるスペースに対して「Can view data」権限が、データプロジェクトがあるスペースに対して「Can view」権限が必要です。
DDL プロパゲーションのサポート
レプリケーション・プロジェクトを設定する際に、ソース・システムで発生した DDL 操作をターゲット・システムと自動的に同期するようにタスクを設定できるようになりました。ターゲットテーブルへのDDL変更の適用は、以下のようなイベントに対して有効にすることができます。
- 新しいカラムの追加または既存のカラムの変更
- テーブル選択用のワイルドカードパターンに基づく新しいテーブルの追加
接続作成インターフェイスの改善
すべてのコネクターを1つの共通インターフェイスに統合しました。ソース、ターゲット、アプリケーションに関係なく、ユーザーは同様の合理化されたインタラクションを利用できます。全てのコネクタの表示と、最近使用されたコネクタの表示を切り替えることができます。
SaaS アプリケーション接続の追加
下記の接続が追加されています。
- ADP
- Enverus OpenInvoice
- Google AdMob
- Google AdSense
- Google Business Profile
- Google Play
- Google Workspace
- Infor Data Lake
- PagerDuty
- SAP Employee Central Payroll
- RingCentral
- TikTok
- UKG Pro Workforce Management (formerly Dimensions)
管理者向けの新機能
ゲートウェイー直接アクセス 新バージョン
Direct Access gateway 1.6.4 がリリースされました。
新機能
- 管理コンソールのQMCのデータゲートウェイのタブで「ログの表示」でログを表示またはダウンロードできます。
- 直接アクセスゲートウェイのサイレントインストール
- セッションの継続性の向上
解決された問題
- configuration.propertiesファイルのパラメーター名の誤り
- リロード・ポッドの可用性
その他
- スペースの新しい権限 Can Operate が追加されました。管理スペースでリロードスケジュールを設定することができます。
- ゲートウェイの新バージョンの通知を受け取ることができるようになりました。
- キャパシティ消費量確認アプリが更新されています。
- OAuth machine-to-machine トークンに admin.apps scopeを割り当てている管理者は、API を使用して Qlik Cloud アプリケーションのすべてのメタデータを管理できます。
- OAuthのインパーソネーショントークンによって、OAuthクライアントが登録されているテナント内のユーザーの代わりに、Webアプリケーションがアクセストークンを作成することができます。

-
April is in the air!
Hello Qlik Community! Today’s release of enhancements is short and sweet but we will be adding to it over the next couple of weeks. New branding on ... Show MoreHello Qlik Community!
Today’s release of enhancements is short and sweet but we will be adding to it over the next couple of weeks.
New branding on Footer
The branding of the footer has been refreshed to align more with Qlik.com.
Tweaked Pendo code
To alleviate duplicate accounts within Pendo, we have adjusted some code.
Join Qlik Nation
Customers and Partners of Qlik can join Qlik Nation, our advocacy platform to participate in activities that earn points towards Qlik swag. Not a member? You can find invitation widgets sprinkled through some of the forums.
Stay tuned for more to come during the month of April!
Everyone have a fantastic week!
Your Community Admins,
Melissa, Sue, Jamie and Nicole
-
Onyx DataDNA Feb 2024 Challenge
Onyx DataDNA Feb 2024 Challenge RICElectronic Product Reviews. Using data provided by OnyxDataDNA and building a application to look at reviews of pro... Show MoreOnyx DataDNA Feb 2024 ChallengeRICElectronic Product Reviews. Using data provided by OnyxDataDNA and building a application to look at reviews of products. Created NPS scores and Weighted values. This is to cater for manufacturers that have very few reviews compared to those that have many.Discoveries
Weighted data makes data more accurate. NPS Classification is needed when looking at review data. Sentiment Analysis would be the next addition to make the data even more accurate.
Impact
Review data is tricky as the data from 1 to another differs in so many ways. Careful consideration is needed when making decisions. Weighted data makes data more accurate. NPS Classification is needed when looking at review data. Sentiment Analysis would be the next addition to make the data even more accurate.
Audience
Marketing and BI Developers
Data and advanced analytics
Weighted data makes data more accurate. NPS Classification is needed when looking at review data. Sentiment Analysis would be the next addition to make the data even more accurate.
-
【オンデマンド配信】銀の弾丸はない…しかし。タテヨコを貫くデータ活用の起爆剤
企業のビジネス活動において、データはこれまで以上に必要不可欠な資産となっています。増え続けるデータを管理・統合・分析し、データでアクションを起こす必要性が増している現在、成功している企業はどのようなデータ戦略を実行しているのか?本 Web セミナーシリーズでは、Qlik でデータからアクションを起こ... Show More企業のビジネス活動において、データはこれまで以上に必要不可欠な資産となっています。増え続けるデータを管理・統合・分析し、データでアクションを起こす必要性が増している現在、成功している企業はどのようなデータ戦略を実行しているのか?
本 Web セミナーシリーズでは、Qlik でデータからアクションを起こすデータ主導のビジネスで成功しているお客様より、課題から導入の経緯、デモンストレーション、活用例などをご紹介します。※ 参加費無料。パソコン・タブレット・スマートフォンで、どこからでもご視聴いただけます。
オンデマンド配信:
銀の弾丸はない…しかし。タテヨコを貫くデータ活用の起爆剤データはあるがどう活かせば良いかわからない、もっと組織の壁を越えてデータを活用したいなど、データの持つ可能性に気づいているが故に多くの方が悩みを抱えていると思います。
スズキ株式会社では、さまざまな部門でデータ活用が進んでいます。その中の1つである海外営業部門では、海外拠点の膨大なデータを収集して可視化。ユーザー自身がデータを分析し、売上状況や在庫管理に活用しています。いかにして部門や国をまたいだデータ活用の機運が高まったのか。Qlik Sense の導入経緯や活用例、課題の克服など、デモを交えてご紹介します。また、Qlik 技術担当者との対談では、技術面や社内の活用状況などを詳しくお伺いします。
-
Welcome Marcin Stawarz - Qlik Educator Ambassador for 2024!
Marcin is a Research Assistant at the Faculty of Economic Sciences and Management at Nicolaus Copernicus University in Toruń, Poland. His role focuses... Show MoreMarcin is a Research Assistant at the Faculty of Economic Sciences and Management at Nicolaus Copernicus University in Toruń, Poland. His role focuses on integrating theory with practice in teaching and research in the subject areas of Economics, Management, Data Analysis and Data Science.
Marcin has been an enthusiastic advocate and educator of Qlik for several years, introducing students and colleagues to the dynamic world of data analytics through the Qlik Academic Program. His journey with Qlik began out of a desire to provide a more interactive and practical learning experience in the field of data visualization and analytics. Recognizing the increasing importance of data literacy in today’s digital landscape, Marcin was inspired to incorporate Qlik into his curriculum, leveraging the program’s comprehensive resources, including cloud-based analytical software, Qlik Sense, and an extensive library of educational materials. These tools have allowed him to transform traditional classroom settings into vibrant, hands-on learning environments where students can directly apply their knowledge in real-world scenarios.
Marcin has incorporated many different resources from the Qlik Academic Program into his teaching ,” I've used the Qlik Sense software to facilitate labs where students can learn to build their own dashboards. This experience has proved invaluable for their understanding of data structures and the principles of effective data visualization. I incorporate the Data Analytics Curriculum provided by Qlik into my syllabus to give students a structured pathway through the complexities of data analysis. It helps them grasp the intricacies of data in the context of economic research. For assessment, I lean on the Qlik Sense Qualifications, like the Business Analyst Pathway, to evaluate students' proficiency in utilizing Qlik tools for economic data analysis. This qualification process not only tests their technical skills but also their ability to interpret data and make data-driven decisions. In addition to these, I encourage students to complete the Qlik Data Literacy Course training to ensure they possess a foundational understanding of data literacy, which is essential in today's data-centric world.”
Marcin's integration of Qlik into his curriculum has significantly empowered his students by providing them with firsthand exposure to the latest technologies in data analytics. Marcin says, “This exposure does more than just enhance their educational experience; it arms them with a competitive advantage in the job market and cultivates essential skills that are in high demand across industries. By familiarizing students with Qlik's cutting-edge tools, it not only prepares them for the challenges of the modern workforce but also ensures they stand out to potential employers, ready to contribute meaningfully from day one. The benefits for students extend beyond the classroom, setting a foundation for lifelong learning and success in a rapidly evolving professional landscape.”
Looking ahead to 2024, Marcin aims to further enrich his students' learning experiences by integrating new methodologies and focusing on the development of critical analytical skills that are increasingly in demand across various industries. He is keenly observant of the evolving landscape of analytics and the growing need for data literacy in higher education, recognizing the potential of analytics to transform not just business strategies but also educational paradigms.
Outside the classroom, Marcin enjoys a balanced life, residing in a community that shares his passion for education and innovation. Whether exploring new hobbies, spending time with his family, or engaging in other professional endeavors, he embodies the spirit of lifelong learning and curiosity.
As a Qlik Educator Ambassador, Marcin aspires to not only enhance his own teaching practices but also to contribute to the broader educational community by sharing his experiences and insights. He views this role as an opportunity to advocate for the importance of data literacy, support fellow educators in incorporating analytics into their curricula, and inspire a new generation of students to explore the vast potential of data analysis.
For more information about how you can get access to free Qlik Sense software and training resources, please go to qlik.com/academicprogram.
-
This week’s reporting services news, moves and changes
As April dawns upon us, get ready to witness a total solar eclipse, celebrate the beauty of cherry blossoms, and brace for some new changes in reporti... Show MoreAs April dawns upon us, get ready to witness a total solar eclipse, celebrate the beauty of cherry blossoms, and brace for some new changes in reporting services.
News
If you have been ‘keeping tabs’ on the latest in Qlik Cloud Reporting, you probably have heard by now about some exciting new features, hint, hint tabular reporting.
In the latest news, it’s time to say goodbye to complex pricing tiers and leave behind any worries about exceeding your reporting limits. It’s all about striking a balance…
Complex tiers are out…and simple ‘Small and Large Add-On Packs’ are in to replace them, alongside standardized limits for easier management.
The following tiers of Reporting Services are being retired: Startup, Scaleup, Premier, Premier add-on.
In reality, these tiers felt too complex and honestly just a little confusing.
Current User-Based customers can now purchase ‘Small and Large Add-On Packs’. While those on current Capacity model will continue with the existing numbers until their contract ends.
Moves
Increased Reports in Included Tier
We're boosting the quantity of reports in the Included tier from 100 to 1000, giving you more room to prepare, and distribute your reports.
Changes
New Default Values for Premium and Enterprise Tiers
As part of these changes, we're also introducing new default values for the Premium and Enterprise tiers of the Capacity model, ensuring a smoother and more tailored experience.
Big picture
Now that you're up to speed on these changes...
From April onwards, those who have purchased Reporting Services and find themselves needing more than their allotted amount, can easily purchase additional reports to keep things running smoothly.
This means you might hit a roadblock, – if you want to expand, just reach out to your sales team.
You can check your usage on the Qlik Management Console's home screen, putting you firmly in control of your reporting requirements.
And for those who haven't jumped on board yet, get ready for a boost – your monthly cap is increasing to 1,000 reports, up from the previous 100.
These updates have been designed to streamline your reporting experience, enhance transparency, have control over your usage, and deliver more value than ever before.
Need more information?
- Reporting Services Support Blog | Qlik Community
- Reporting from Qlik Cloud Analytics | Qlik Help Page
- Tabular Reporting Corporate Blog
-
Interacting with data using Enigma.js: Hypercubes and List Objects
When using Enigma.js to communicate with the Qlik Associative Engine to build visualizations for instance or simply to get access to data from Qlik Se... Show MoreWhen using Enigma.js to communicate with the Qlik Associative Engine to build visualizations for instance or simply to get access to data from Qlik Sense, you will certainly come across the concept of Generic Objects, which are structures for storing and interacting with data in an application. They are considered generic because of they are flexible structures that can represent many different app components such as sheets, bookmarks, hypercubes, lists etc..
In this blog post, we will go over Hypercubes and List Objects providing a brief explanation of the concepts and how to use them with enigma.js
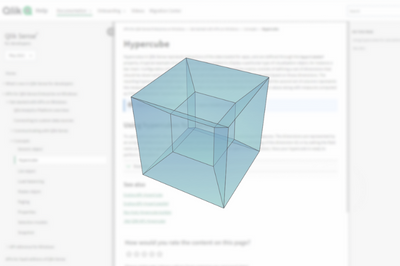
Hypercubes
In Qlik Sense, a Hypercube is an interface for defining a set of data to extract. It is the definition provided to the Qlik Data Engine, which holds all information on which data is queried and how it’s calculated. If selections are applied to a Hypercube, only the selected values will be returned.
For example, this can represent data needed to display some type of visualization such as a bar chart that shows “Sum of Sales” by “Salesperson”. At its simplest form, you can think of it as a table comprised of rows and columns. In that sense, our Hypercube that would power our barchart, would consist of a table with “Salesperson” as a column, and the evaluated “Sum(Sales)” expression as the other column. The engine will fill the cells of this table and extract all the information.
In order to use a Hypercube, we need to define it through the “qHyperCubeDef” object which is passed on to the Qlik Engine API to create a query for processing the data.
A very simple definition of a Hypercube looks like this:
qHyperCubeDef: {
    qDimensions: [],
    qMeasures: [],
    qInitialDataFetch: [{
        qWidth: 2,
        qHeight: 50
    }]
  }
But since it is a very flexible tool of extracting data, that means that there is a huge amount of settings available for it. You can view the full definition of the structure here.
Let’s go over the most important ones:
- qDimensions: defines the array of dimensions that will be used in the HyperCube. You can have multiple dimensions depending on the results you want.
- There is a number of settings within the dimension that you can set. More about these here.
- For instance, qNullSuppression: which removes null values in the dimension
- qShowAll, which if set to true, displays all dimension values, regardless of whether they are selected or not.
- etc...
- qMeasures: similar to how qDimensions are defined, but used to define measures, i.e: calculations performed for each distinct value of dimensions.
- qInitialDataFetch: defines how many data cells are initially retrieved from the calculated HyperCube.
- qSuppressZero: if set to true, removes rows that have zero values across the entrie HyperCube row
- qMode: defines the structure of the HyperCube that will be returned. By default, the data is returned as a straight table representation. But more advanced modes are available, such as:
- Pivot table representation (qMode -> P)
- Stacked table representation (qMode -> K)
- Tree representation (qMode -> T)
- There is a number of settings within the dimension that you can set. More about these here.
Below is an example of a Hypercube where we define 1 dimension (ID) and 1 measure (=Sum(Value)), Notice that we define qWidth and qHeight properties within qInitialDataFetch as 2 and 5 respectively, since we have 2 columns and would like to get 5 rows of data for a total of 10 cells.
P.S: The maximum number of cells (qWidth * qHeight) allowed in an initial data fetch is 10,000.
const properties = {
  qInfo: {
    qType: 'my-straight-hypercube',
  },
  qHyperCubeDef: {
    qDimensions: [
      {
        qDef: { qFieldDefs: ['ID'] },
      },
    ],
    qMeasures: [
      {
        qDef: { qDef: '=Sum(Value)' },
      },
    ],
    qInitialDataFetch: [
      {
        qHeight: 5,
        qWidth: 2,
      },
    ],
  },
};
So how does the implementation look like in enigma.js?
For the purposes of this example, we are creating a Session App (i.e: have an inline script and create an app on the fly).
const qlikScript = `
TempTable:
Load
RecNo() as ID,
Rand() as Value
AutoGenerate 100
`;

const properties = {
  qInfo: {
    qType: 'my-straight-hypercube',
  },
  qHyperCubeDef: {
    qDimensions: [
      {
        qDef: { qFieldDefs: ['ID'] },
      },
    ],
    qMeasures: [
      {
        qDef: { qDef: '=Sum(Value)' },
      },
    ],
    qInitialDataFetch: [
      {
        qHeight: 5,
        qWidth: 2,
      },
    ],
  },
};

const session = createSession();

// Open the session and create a session document:
session.open()
  .then((global) => global.getActiveDoc())
  .then((doc) => doc.setScript(qlikScript)
    .then(() => doc.doReload())
    // Create a generic object with a hypercube definition containing one dimension and one measure
    .then(() => doc.createObject(properties))
    // Get hypercube layout
    .then((object) => object.getLayout()
      .then((layout) => console.log('Hypercube data pages:', JSON.stringify(layout.qHyperCube.qDataPages, null, '  ')))
      // Select cells at position 0, 2 and 4 in the dimension.
      .then(() => object.selectHyperCubeCells('/qHyperCubeDef', [0, 2, 4], [0], false))
      // Get layout and view the selected values
      .then(() => console.log('\n### After selection (notice the `qState` values):\n'))
      .then(() => object.getLayout().then((layout) => console.log('Hypercube data pages after selection:', JSON.stringify(layout.qHyperCube.qDataPages, null, '  '))))))
  // Close the session
  .then(() => session.close())
  .catch((error) => {
    console.log('Session: Failed to open socket:', error);
    process.exit(1);
  });
Notice that after opening the enigma session, and calling the necessary methods for our session app, we call “createObject” to create a Generic Object with our Hypercube definition containing 1 dimension and 1 measure, then get the Hypercube Layout which returns a bunch of results including our data.
We’re mostly interested in “qDataPages” which holds our calculated data. Below is how the typical response looks like:
Going back to our code, the full qDataPages results are as follows from our first console.log:
Hypercube data pages: [
  {
    "qMatrix": [
      [
        {
          "qText": "1",
          "qNum": 1,
          "qElemNumber": 0,
          "qState": "O"
        },
        {
          "qText": "0.73213545326144",
          "qNum": 0.732135453261435,
          "qElemNumber": 0,
          "qState": "L"
        }
      ],
      [
        {
          "qText": "2",
          "qNum": 2,
          "qElemNumber": 1,
          "qState": "O"
        },
        {
          "qText": "0.66564685385674",
          "qNum": 0.6656468538567424,
          "qElemNumber": 0,
          "qState": "L"
        }
      ],
      [
        {
          "qText": "3",
          "qNum": 3,
          "qElemNumber": 2,
          "qState": "O"
        },
        {
          "qText": "0.66189019801095",
          "qNum": 0.6618901980109513,
          "qElemNumber": 0,
          "qState": "L"
        }
      ],
      [
        {
          "qText": "4",
          "qNum": 4,
          "qElemNumber": 3,
          "qState": "O"
        },
        {
          "qText": "0.98009621817619",
          "qNum": 0.9800962181761861,
          "qElemNumber": 0,
          "qState": "L"
        }
      ],
      [
        {
          "qText": "5",
          "qNum": 5,
          "qElemNumber": 4,
          "qState": "O"
        },
        {
          "qText": "0.48425585823134",
          "qNum": 0.4842558582313359,
          "qElemNumber": 0,
          "qState": "L"
        }
      ]
    ],
    "qTails": [
      {
        "qUp": 0,
        "qDown": 0
      }
    ],
    "qArea": {
      "qLeft": 0,
      "qTop": 0,
      "qWidth": 2,
      "qHeight": 5
    }
  }
]
Notice that we have additionally called the “selectHyperCubeCells” method in order to make a selection on the cells at positions 0, 2, and 4 in the Dimension. Here is how the results of qDataPages looks like after the selection:
### After selection (notice the `qState` values):
Hypercube data pages after selection: [
  {
    "qMatrix": [
      [
        {
          "qText": "1",
          "qNum": 1,
          "qElemNumber": 0,
          "qState": "S"
        },
        {
          "qText": "0.73213545326144",
          "qNum": 0.732135453261435,
          "qElemNumber": 0,
          "qState": "L"
        }
      ],
      [
        {
          "qText": "3",
          "qNum": 3,
          "qElemNumber": 2,
          "qState": "S"
        },
        {
          "qText": "0.66189019801095",
          "qNum": 0.6618901980109513,
          "qElemNumber": 0,
          "qState": "L"
        }
      ],
      [
        {
          "qText": "5",
          "qNum": 5,
          "qElemNumber": 4,
          "qState": "S"
        },
        {
          "qText": "0.48425585823134",
          "qNum": 0.4842558582313359,
          "qElemNumber": 0,
          "qState": "L"
        }
      ]
    ],
    "qTails": [
      {
        "qUp": 0,
        "qDown": 0
      }
    ],
    "qArea": {
      "qLeft": 0,
      "qTop": 0,
      "qWidth": 2,
      "qHeight": 3
    }
  }
]
List Objects
Alongside qHyperCube, the family of Generic Objects provides us with another structure called qListObject.
Unlike a Hypercube, a List Object better serves the purposes of displaying one single dimension without any required calculation, meaning no metrics are required to be defined.
As such, it is fairly straightforward to work the list objects, and their definition is very similar to the qHyperCube object, with some added extra properties minus measures.
I usually use List Objects when I want to build a list of values to be used for selections.
The following code is an example of creating a qListObjectDef and writing the resulting list object into the console:
List object data: [
  [
    {
      "qText": "0.063513102941215",
      "qNum": 0.06351310294121504,
      "qElemNumber": 0,
      "qState": "O"
    }
  ],
  [
    {
      "qText": "0.15987460175529",
      "qNum": 0.15987460175529122,
      "qElemNumber": 1,
      "qState": "O"
    }
  ],
  [
    {
      "qText": "0.50091209867969",
      "qNum": 0.5009120986796916,
      "qElemNumber": 2,
      "qState": "O"
    }
  ]
]
After selection of the first value, the qDataPages response looks like the following:
(Notice that with a qListObject, all values are rendered, regardless of whether they have been excluded or not.If selections are applied to a list object, the selected values are displayed along with the excluded and the optional values. We do however hava access to the qState property which lets us know if the value is selected (S), alternate (A), etc..)
List object data: [
  [
    {
      "qText": "0.063513102941215",
      "qNum": 0.06351310294121504,
      "qElemNumber": 0,
      "qState": "S"
    }
  ],
  [
    {
      "qText": "0.15987460175529",
      "qNum": 0.15987460175529122,
      "qElemNumber": 1,
      "qState": "A"
    }
  ],
  [
    {
      "qText": "0.50091209867969",
      "qNum": 0.5009120986796916,
      "qElemNumber": 2,
      "qState": "A"
    }
  ]
]
Attached is a zip file containing example code that shows how a default Hypercube, Pivot Hypercube, Stacked Hypercube, and a List Object are used in enigma.js.
To run the code:
- first run “npm install”
- change the .env file with your tenant and API key (learn how to get an API key here).
- then, run “node filename.js” for each file and check the console logs.
To see how Hypercube can be used as part of creating visualizations with Nebula.js, checkout my previous blog post: https://community.qlik.com/t5/Qlik-Design-Blog/Create-a-Slope-chart-with-tooltips-and-brushing-using-Nebula-js/ba-p/1827168
- qDimensions: defines the array of dimensions that will be used in the HyperCube. You can have multiple dimensions depending on the results you want.
-
【5/21(火)- 23(木)開催】2024 ガートナー データ & アナリティクス サミット
Qlik は、今年も「ガートナー データ & アナリティクス サミット」に、講演およびブース出展します。Qlik は、AI 戦略をサポートするデータ統合・データ品質・分析ソリューションのリーダー企業です。ビジネス課題の解決、新たな目標の達成、重要なビジネスニーズへの対応など、企業のデータ活用全般をサ... Show MoreQlik は、今年も「ガートナー データ & アナリティクス サミット」に、講演およびブース出展します。
Qlik は、AI 戦略をサポートするデータ統合・データ品質・分析ソリューションのリーダー企業です。ビジネス課題の解決、新たな目標の達成、重要なビジネスニーズへの対応など、企業のデータ活用全般をサポートします。データとアナリティクスのリーダーが一堂に会する世界的な IT イベントに、ぜひご参加ください。Qlik 講演および Qlik ブースで、皆さまをお待ちしております。
Qlik は、Gartner® Magic Quadrant™ のデータ統合ツール・データ品質・アナリティクス / BI プラットフォームの分野で、リーダーの 1 社に評価されました。
詳細を見る
【開催概要】
日時:2024年 5月 21日(火)– 23日(木)
会場:グランドニッコー東京(台場) -
People Analytics
People Analytics FarolBIThe People Analytics application aims to identify and present the main indicators in the human resources area, where it presen... Show MorePeople AnalyticsFarolBIThe People Analytics application aims to identify and present the main indicators in the human resources area, where it presents possibilities of reducing the exchange/change of employees, decentralizing the management of employees and their payroll events, freeing up the Human Resources area for other activities. The focus is to decentralize People management.Discoveries
Reduction of turnover, reduction of absences, reduction of overtime, payroll spending planning, benefits management, decentralized management!!!
Impact
Decentralized Management of People and Benefits! Budget management and Payroll planning!
Audience
Hour control; Benefits Control; Fair management;
Data and advanced analytics
Reduction of overtime; Control and monitoring of hiring new employees; Reduction in hiring expenses!!!
-
Welcome back Angel Monjaras- Qlik Educator Ambassador for 2024!
I am pleased to introduce Angel Monjaras as the Qlik Educator Ambassador for 2024! Angel is a Professor of Business Intelligence at Instituto Tecnolog... Show MoreI am pleased to introduce Angel Monjaras as the Qlik Educator Ambassador for 2024! Angel is a Professor of Business Intelligence at Instituto Tecnologico Autonomo De Mexico (ITAM), where he’s been using Qlik in his teaching for seven years.
For this year’s iteration of his course, he is debuting a BI Best Practices Catalog on Qlik Sense that will enable students to find the most common metrics and dimensions for each business area and / or industry.
According to Angel, “This will free up class time to delve into Data Literacy and AI topics that will help students feel comfortable speaking about data, and help them stay grounded and focus on real issues and solutions, instead of jumping on the many bandwagons, buzzwords, and false promises headed their way.”
While he’s always integrated Qlik software, the past couple of years, he started to integrate some of the learning exercises from the Qlik Academic Program, “Students perform various exercises and homework, including regression analysis, visualization best practices, common visualization pitfalls, and data quality. They also design a dashboard from scratch as part of a practical course-long BI project. We use some exercises taken from QCC and the Data Analytics Curriculum, since they provide good sample data.”
Angel’s passion for Qlik goes beyond his own classroom, he has been introducing new educators from Universidad Nacional Autónoma de México, and other universities to Qlik. Angel has conducted introductory workshops for students. Angel plans to share his knowledge even further this year, by continuing to conduct open workshops for any student at his university to join.
Angel is a 2024 Qlik Luminary and will host a session in Qlik Connect this year: “C40: Taking our world-changing work to the next level with Qlik Cloud”
For Angel, one of the most rewarding parts of teaching Qlik has been seeing his students leave university and get jobs, become Qlik customers, and even fellow professors.
Educators and students can get access to free Qlik software and training resources, qualifications and certifications by applying to the Academic Program today: qlik.com/academicprogram
-
Tennis Grand Slam Final Analysis
Grand Slam Tennis Analysis Quick Intelligence An application which analyses data from 145 years of Tennis Grand Slam data, providing insights by... Show MoreGrand Slam Tennis AnalysisQuick IntelligenceAn application which analyses data from 145 years of Tennis Grand Slam data, providing insights by player and tournament over time.
This was created as a demonstration of the technique of pulling data from HTML tables on Web Pages (in this case two Wikipedia pages) and also to show off category colours in our Instant Sense Application.
This application is a template into which any data source can be loaded, along with metadata describing the data to give a fully working Sense application in a very short space of time.
Find out more, and download the app, from here:Or jump straight to the live-app to make selections and discoveries in the data:
https://www.quickintelligence.co.uk/sense/gs.html
Discoveries
Our Instant Sense Application allows any data set to be uploaded and analysed. Even relatively simple datasets, like this one, can yield interesting discoveries. Perhaps the most striking thing is the large gap between the top seven players and the rest of the pack. The other thing is how the very top female players beat the top male players on many different measures.
Impact
As sports are divided into male and female competitions the data are often displayed and considered separately. By loading the data from two different sources and blending them a combined view can be given. Colouring the data by the competition dimension makes the achievements of the female players stand out.
Audience
The important thing when bringing data and analytics to people is to bring them data that they can engage with. Sometimes the simplest of data sources can be best at telling a story and drawing people in. Once those users have got used to navigating a simple dataset on a topic that interests them they will be ready to engage with the business data that can give them the edge.
Data and advanced analytics
Our Instant Sense Application is free to download and use and can be used over any dataset. It's a great way to provide a proof of concept and to quickly discover which measures are worth tracking. It ships with a number of scripts that are generally useful, such as Qlik Session Monitors and QVD Profiling, as well as scripts to load from online sources like this one.

-
Qlik Cloud and Qlik Sense on-premise: Upcoming cosmetic changes of font sizes fo...
Hello Qlik Users, Beginning on April 22nd 2024, Qlik Cloud will change how the font sizes for titles, subtitles, and footnotes are displayed. The chan... Show MoreHello Qlik Users,
Beginning on April 22nd 2024, Qlik Cloud will change how the font sizes for titles, subtitles, and footnotes are displayed. The change will carry over to Qlik Sense Enterprise on Windows with its May 2024 release.
What is being changed?
Font sizes for titles, subtitles, and footnotes are controlled by either:
- the theme, in which a customer can define a set pixel size (such as 16px),
- or in the property-styling panel, where the same option is available.
The conversion factor Qlik uses at present is incorrect, caused by a defect introduced by a previous change in a base font type.
What does this mean?
Currently, we convert using 13 as a base when we should be using 14. This results in the font size being slightly larger than the one set by the user.
The current scaling ratio is 1/13 * 14 =~ 1.077.
As an example:
The default theme Horizon, currently set to a 16-pixel default size, is in reality using 17.23 pixels.
Why are font sizes being changed?
Since we use other technologies to embed charts, we don’t want to replicate this error across all interfaces just to get matching title sizes. This means that we’ll now fix this defect, and start using the correct font size.
When will font sizes be changed?
The fix is planned for Qlik Cloud on April 22nd 2024.
Qlik Sense Enterprise on Windows will receive the fix in its May 2024 release.
How exactly will this affect me?
After the fix is deployed, the text in titles, subtitles and footnotes will appear smaller (about 93% of the current size), reverting to the intended size set by the user or the theme developer.
Since this will free up a small amount of space inside each object area, charts and graphics will become slightly bigger.
In rare scenarios, the resulting expansion might result in a different look for charts, where certain features (like labels or legends) appear, move or disappear due to the reaching of specific visual breakpoints.
What do I need to do to benefit from this change?
No action is required for Qlik Cloud users. This change will automatically be applied to all the dashboards at the time of deployment. Qlik Sense Enterprise on Windows users will need to see their platform being upgraded to May 2024.
Can I preview the changes?
A preview is not possible before the deployment on April 22nd.
We're available for questions if needed! As always, thank you for choosing Qlik,
Qlik Support -
Connector Factory - February & March 2024 releases
Qlik Data Integration Additional SaaS application connectors We’re continuing to expand the connectivity of Qlik Cloud Data Integration with a new gr... Show MoreQlik Data Integration
Additional SaaS application connectors
We’re continuing to expand the connectivity of Qlik Cloud Data Integration with a new group of connectors that just got released. These connectors will enable you to gather business data from more applications that focus on finance, advertising, and human resources as well as other subjects. By eliminating the need for custom connectors to access these sources, Data Engineer productivity is increased and Data Consumer’s time to insight is decreased.
- ADP
- Enverus OpenInvoice
- Google AdMob
- Google AdSense
- Google Business Profile
- Google Play
- Google Workspace
- Infor Data Lake
- PagerDuty
- SAP Employee Central Payroll
- RingCentral
- TikTok
- UKG Pro Workforce Management (formerly Dimensions)
Improved interface
We’ve added more capabilities as well as consolidated all connectors into one common interface. This means that regardless of whether it’s a source, target or application, users will have a similar, streamlined interaction. This includes improved searching and filtering capabilities along with displaying all recently selected connectors.
Qlik Replicate: New Databricks authentication type
Qlik Replicate recently added OAuth authorization protocol support with Databricks. In the November SR release of Qlik Replicate, we expanded our OAuth support methods to Databricks endpoints. This is paving the way for supporting more endpoints with the OAuth protocol in the future. You can learn more about this new capability in this blog.
Qlik Analytics
New SAP ODP Connector
We recently expanded our support for SAP with a new SAP ODP Connector for Qlik Cloud Analytics. This connector provides connectivity to the SAP Operational Data Provisioning (ODP) framework which includes many benefits to SAP users vs. previous, existing SAP connectors including:
- Simplified access to CDS Views and HANA Views
- Access to Extractors, without the use of standalone network service
- Usable with an SAP Runtime license
- Does not require any separate Qlik SAP Connector license
- No need for an SAP transport installation, particularly useful with an SAP managed cloud system
- Up to 25% faster performance vs. Qlik’s existing SAP connectors
Learn more about this connector here
Note that this new connector is separate from an SAP ODP Connector that’s already available in Qlik Data Integration Client-Managed.
Qlik Application Automation
We continue to add more connectors and capabilities to our no-code cloud service that streamlines workflows between SaaS applications and Qlik Cloud.
New Connectors
monday.com - This connector enables your automation to interact with the cloud-based platform that is used to build work management tools and software applications. You can find out more about the connector in this blog.
AWS Lambda - This connector allows users to easily launch Lambda functions using the AWS serverless platform, which simplifies data-driven automation. You can find out more about the connector in this blog.
Updated Connectors
Microsoft Azure OpenAI - users can now run the create completion block with exactly the same parameters as the Qlik Sense connector.
Inphinity - We’ve upgraded the existing blocks in this connector to work with the next version of Inphinity’s API. Additionally, it’s now possible to insert or delete records.
Qlik Platform Operations - Numerous productivity enhancements have been added to this connector.
-
Predictive AI – Continued Innovation in AutoML
With Qlik AutoML, we make machine learning available to more than just professional data scientists. Your analytics users and teams can now become ci... Show MoreWith Qlik AutoML, we make machine learning available to more than just professional data scientists. Your analytics users and teams can now become citizen data scientists and generate predictions in a simple and effective way for the “other 90% of use cases” not covered by data scientists – areas such as sales forecasting, churn reduction, customer acquisition, inventory optimization, spend analysis, etc. We offer a simple yet powerful, code-free ML workflow with AI-assistance and unlimited experimentation. Predictions are delivered with full explainability so you can see not just what might happen but why. And you can easily publish predictions or integrate models into Qlik Sense for real-time associative exploration and what-if scenario planning.
We’ve recently made a number of improvements to Qlik AutoML that will unlock even more value for customers and prospects looking to democratize the power of predictive AI. With these improvements you get more advanced feature engineering and explainability, better control over users and roles, more iterative experimentation, and improved performance. Specifically:
- We’ve added automated free text feature engineering, allowing far better prediction from free text fields. Under the hood we’re using advanced techniques to look for signal within free text strings, generating 10’s of thousands of possible features which are automatically evaluated for importance and used for prediction. All this is invisible to the user, but you’ll notice text fields will have much better predictive influence. This complements the date feature engineering capability we released last year, which automatically parses dates into usable features.
- Organizations now have role-based access control for AutoML users. We’ve added two new user roles to support AutoML – experiment contributors and deployment contributors, which can be assigned to specific users or groups. With this, you can now control and limit access to AutoML to the right types of users.
- You now get SHAP (explainability) data for multiclass problems. Prior to this, SHAP data was not available for these types of models, but now you can generate and download explainability data in the same manner as binary classification and regression-based models.
- You can now change the data set for existing experiments. Users can now more easily iterate and refine experiments without having to create a new experiment when changing features or retraining models. You can now re-use the same experiments, with the same version history and settings, when changing features in the data set or loading new sets of records. This means you can more easily test new features in an iterative manner, and refresh models with new historical data if business conditions have changed.
- We’ve improved the performance of the real-time connector. Real-time integration of predictive models within analytics apps supports associative exploration and what-if analysis. With this update, we’ve revised the architecture to improve speed and better support real-time production workloads.
Going forward, we are continuing to invest heavily in our AI roadmap, including our augmented analytics capabilities, predictive and generative AI, and even unstructured data insights. Stay tuned for much more to come in all these areas at our annual customer event – Qlik Connect, in June. REGISTER Today!
- We’ve added automated free text feature engineering, allowing far better prediction from free text fields. Under the hood we’re using advanced techniques to look for signal within free text strings, generating 10’s of thousands of possible features which are automatically evaluated for importance and used for prediction. All this is invisible to the user, but you’ll notice text fields will have much better predictive influence. This complements the date feature engineering capability we released last year, which automatically parses dates into usable features.
-
Get to know the Engine API with Qixplorer
For those of us who want to go beyond the out-of-the-box capabilities of Qlik Sense and want to leverage the full potential of the platform to create ... Show MoreFor those of us who want to go beyond the out-of-the-box capabilities of Qlik Sense and want to leverage the full potential of the platform to create complex visualizations or satisfy custom development needs, understanding the Engine API is fundamental to taking advantage of what Qlik Sense hides under the hood.
The Qlik Engine API is a websocket protocol that uses JSON RPC 2.0 to communicate between the Qlik Associative Engine and clients. It works independently of any platform and programming language as long as it supports WebSockets and can parse JSON.
A great place to get your feet wet with trying out the Engine API is through Qixplorer (You might remember this as the Engine API Explorer on Qlik Managed). The tool that you can access at https://qixplorer.qlik.dev features a newly reimagined user interface and additional updates for a better experience.
Right off the bat, you can see that the format is divided into 4 main sections:
- Left: This is where you configure your connection to the tenant, pick the app, and browse through methods made available for your selected object.
- Middle: This is where you can see your requests and responses
- Bottom: This area is where you can construct and modify your requests and execute them
- Right: This is a neat feature that shows you inline documentation as you explore API methods
Other settings include a Light/Dark mode toggle at the top left, as well as a Layout toggle that lets you switch between the Original Layout (side by side request and response sections) or, my favorite, the Chat Layout.
How to use Qixplorer?
The first thing you would need to create a new connection to your Qlik Cloud tenant is a Web Integration ID. You can grab that by going to your tenant’s Management Console, under Web, Create a new integration and add https://qixplorer.qlik.dev as an origin.
Once you have the generated ID in hand, create a new connection on Qixplorer as shown below:
The next step is to choose the app you want to connect to from the second dropdown.
Once you select that, you will see that a first request and response have been made automatically. That’s the “OpenDoc” method, it is responsible for opening an app. More about it here.
Notice that a few items are now highlighted on the Left panel that you can start using - including the Doc and Global classes that can be expanded to reveal all the methods you can execute. You can also use the pre-defined Macros to list sheets, dimensions etc...
⚠️Before we continue, keep in mind that when using Qixplorer, you are performing changes directly on your apps, so when executing API methods to update or delete within Qixplorer, it will affect the objects in your apps.
Examples of using Qixplorer
- Using Macros to list sheets in our app
From the Macros dropdown, click on “ListSheets”.
Notice that the Request section at the bottom has our generated JSON with the methods needed to list sheets.
Click on Execute and view the JSON returned in the Response section.P.S: notice that two separate requests have been made by our Macro: CreateSessionObject and GetLayout.
- Using a method from Global
Let’s create an App in our tenant directly from Qixplorer.
First, select the “CreateApp” method from the Global dropdown.
Notice that the right panel has been populated with the inline documentation for our method. This makes it really convenient to view the definition and parameters at a glance.
Within the Request section that now contains the editable JSON, enter a name for the app we’re creating in the “qAppName” property.
Our request and response look like this:
{
  "handle": -1,
  "method": "CreateApp",
  "params": {
    "qLocale": "",
    "qLocalizedScriptMainSection": "",
    "qAppName": "test-qixplorer"
  }
}
You can check your tenant to view the newly created app:
- Using a method from Doc and GenericObject
Let’s retrieve the calculated data from a Table object in our app.
First, we need to get the object. Under ”Doc”, scroll down to GetObject and change the “qId” property to our Table's object id.
Now that we got the object, you can go to ”GenericObject”, then “Select Object” and click on table.
Next, scroll down to the “GetHyperCubeData” method under “GenericObject” and modify the JSON as follows to set the qHeight (number of rows to retrieve) and qWidth (number of columns)
{
  "handle": 2,
  "method": "GetHyperCubeData",
  "params": {
    "qPages": [
      {
        "qHeight": 1000,
        "qWidth": 5,
        "qTop": 0,
        "qLeft": 0
      }
    ],
    "qPath": "/qHyperCubeDef"
  }
}
Click on execute and examine the response:
The Engine API is without a doubt very powerful as it exposes methods that can be used to tap directly into the associative engine and manipulate complex data structures. Having a tool like Qixplorer is a great way to try out the API and learn more about all the methods available in a single place.
Let me know in the comments how you use Qixplorer on you end!
-
Qlik Cloud 日本リージョンへの移行方法
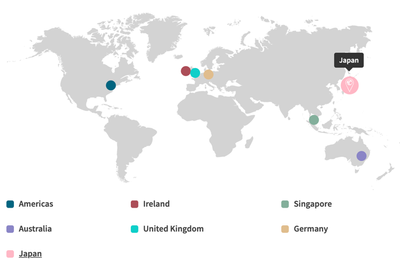
Qlik Cloud に 日本リージョンが開設されました。既存のテナントの移行をされる場合には、まずサポートにケース登録を行い、その後手動で移行する必要があります。 リージョンはテナントの初期設定時に選択できます。 リージョンごとに1テナントに制限されます。テナントの地域を変更する必要がある場合は... Show MoreQlik Cloud に 日本リージョンが開設されました。既存のテナントの移行をされる場合には、まずサポートにケース登録を行い、その後手動で移行する必要があります。
リージョンはテナントの初期設定時に選択できます。
リージョンごとに1テナントに制限されます。テナントの地域を変更する必要がある場合は、新しいテナントを作成する必要があります。既存のテナントをあるリージョンから別のリージョンに移行するには、下記の手順に従ってください。コンテンツの移行や移動は自動では行われません。すべての設定を新しいテナントで再作成し、新テナントにアプリをインポートする必要があります。
下記の手順に従ってください。
1.Qlikサポートにケース登録を行ってください。
連絡先と既存のテナント情報、移動先リージョンをお知らせください。既存のテナント情報は下記の手順で取得できます。
- Qlik Cloud にログインする
- 画面右上角のプロファイルアイコンをクリックする
- 「アプリについて」をクリックする
この依頼に基づき、サポートがライセンスを変更します。移行期間中に2つのテナントを使用したい場合はケース登録時にご依頼ください。基本的には30日間の並行稼働となります。
2.既存テナントからアプリケーションをエクスポートします。既存テナントのアプリケーションの変更は停止する必要があります。
3.サポートの指示に従って新テナントを作成し、設定を行います。
a. IdPを使用している場合は、既存テナントと同様の設定を行ってください。
IdP側でもテナントURLを更新する必要があります。ユーザー認証をテストして確認してください。
b. ユーザー資格の割り当てを行います。
c. スペースを作成します。
d. アプリをインポートします。
e. アラート、レポートサブスクリプション、リロードを設定します。
f. 必要に応じてカスタマイズについても設定を完了させてください。
エクステンションの管理
Webhook
ウェブ統合の管理
API キーの管理4.Qlik サポートに移行が完了したことをお知らせください。期間延長が必要な場合はサポートにご連絡ください。
手順については4月9日のTECH TALK でも詳しく解説します。
【無料Webセミナー】Qlik Cloud 日本リージョン開設!テナント作成と移行方法を解説
よくあるご質問
Q: 日本リージョンはどうすれば使用できますか?
A: テナント作成時の初期設定で Japan を選択すると、日本リージョンを使用することができます。Q: 日本リージョンのデータはどこに保存されますか?
A: 東京と、大阪(バックアップ)に保存されます。下記を参照してください。
Qlik and Talend Subprocessors General Data Protection Regulation (GDPR) - Version 5.1 - February 2024Q: 既にQlik Cloud を使用していますが、日本リージョンへの変更は可能でしょうか?
A: 可能です。サポートにケース登録をし、テナントを移行する必要があります。上記を参照してください。Q: 既にQlik Cloud を使用していますが、日本リージョンへの移行は自動で行われるのでしょうか?
A: 手動ですべての設定を行う必要があります。上記を参照してください。Q: 既にQlik Cloud を使用していますが、日本リージョンへ変更する場合に契約の変更が必要でしょうか?
A: 契約の変更は不要です。Q: 既にQlik Cloud を使用していますが、日本リージョンへ変更する場合に料金は変わりますでしょうか?
A: 料金は変わりません。Q: 日本リージョンでも データ統合機能(QCDI)は使用できますか?
A: 使用できます。Q: 日本リージョンでもユーザーモデルもキャパシティモデルも選択できますか?
A: 選択できます。Q: 既存のテナントから 日本リージョンに移行する場合、テナントのURLは変わりますか?
A: 変わります。新しいURLでご利用ください。Q: 既存のテナントから 日本リージョンに移行する場合、並行稼働は認められるでしょうか?
A: サポートケース登録時に並行稼働のご要望をご記入ください。基本的には30日間は既存リージョンが使用できます。サポートから期限について連絡があります。Q: データゲートウェイを新環境に接続した場合、旧環境を閉じるまで引き続き旧環境でも使えるのでしょうか。A: データゲートウェイは、特定のテナントとのペアになりますので、移行にかぎらず、複数のテナントで同時に使うことはできません。適切なタイミングでの切り替えをお願いします。
Q: 既存テナントと新テナントで、Analyzer Capacity、アプリの自動化、レポーティングなどの消費量は引き継がれますか?並行稼働期間はどのようにカウントされますか?
A: 既存テナントと新テナントは同ライセンスですので、合算となります。Q: アジア圏のリージョン(オーストラリア/シンガポール)から日本リージョンに変更することで、レイテンシーがどの程度、改善されるかについて、情報はありますか。
A: レイテンシーに関してベンチマーキングとなる情報はございません。通常のAWSのリージョンのレイテンシーに依存すると思われます。Q: ケース登録時にいつから30日並行稼働希望といった形で指定できますか?(=新テナント作成日を指定できるか)
A: はい。指定していただくことができます。
-
March Qlik Digest
Welcome to the March Qlik Digest newsletter! We have some exciting news and updates this month, including upcoming webinars, updates on Tabular Repor... Show MoreWelcome to the March Qlik Digest newsletter! We have some exciting news and updates this month, including upcoming webinars, updates on Tabular Reporting, and training courses for Qlik Cloud!
Tabular Reporting in Qlik Cloud
One of the most requested features in Qlik Cloud Analytics is finally here: Tabular Reporting in Qlik Cloud Analytics!
“What is Tabular Reporting?” you may ask. To put it simply, a tabular report in a Qlik Sense app displays table-based data with chart images in an Excel template-defined structure.
Now, what does this mean for you and your business? With Tabular Reporting, report developers can unleash their creativity, crafting tailor-made, intricately detailed XLS or PDF documents infused with Qlik data and visualizations.
Exciting, we know!
For more information, and a quick dose of nostalgia, check out our new Tabular Reporting blog Keeping Tabs on Qlik Cloud Reporting and tune in on March 27th for our webinar series: ‘Do More with Qlik’ – Tabular Reporting for Nprinting Customers.
Looking to unlock big savings on Qlik Certifications?
Looking to up your data and analytics game? Qlik Connect (formerly, QlikWorld) has you covered. This year’s event offers 15 hands-on workshops and 17 certifications.
Register before March 29 to save $200. As an added bonus, all Qlik Connect attendees receive one free certification exam (up to $250 in value), with additional exams only $70 each (up to 72% discount).
Visionary Voices in AI On-Demand
Missed episode 2 of Visionary Voices, or interested in rewatching?
Stream the episode on demand
to hear Qlik’s James Fisher & Nick Magnuson discuss how you can take AI from trends to tangible business tool, from theory to reality.
Qlik Technical Workshops:
Join our live Qlik Technical Workshops to get hands-on guidance from our Adoption Specialists.
Bring your own Qlik Cloud instance and build alongside Qlik experts. We’ll cover the essentials, share step-by-step demos, and answer your questions along the way
Space is limited to ensure an interactive experience, so register today!
Cloud Migration Learning Plan:
Migrating to Qlik Cloud? Qlik has you covered with an in depth learning plan for both Qlik Sense Client-Managed as well as QlikView customers. These tools will assist your migration efforts and create a successful transition plan.


.png")

.png")