Unlock a world of possibilities! Login now and discover the exclusive benefits awaiting you.

Analytics & AI
Forums for Qlik Analytic solutions. Ask questions, join discussions, find solutions, and access documentation and resources.
Data Integration & Quality
Forums for Qlik Data Integration solutions. Ask questions, join discussions, find solutions, and access documentation and resources
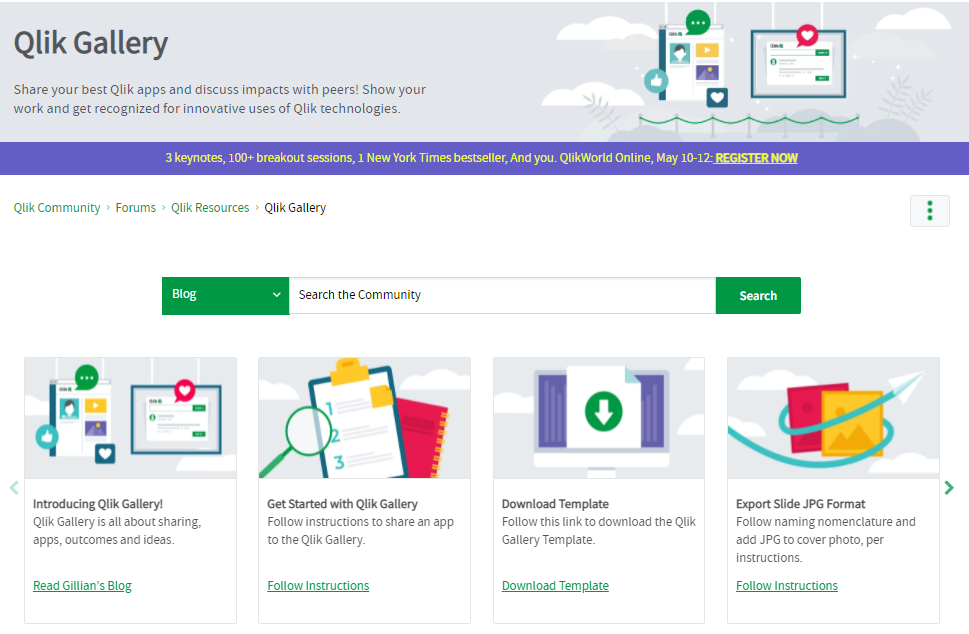
Explore Qlik Gallery
Qlik Gallery is meant to encourage Qlikkies everywhere to share their progress – from a first Qlik app – to a favorite Qlik app – and everything in-between.
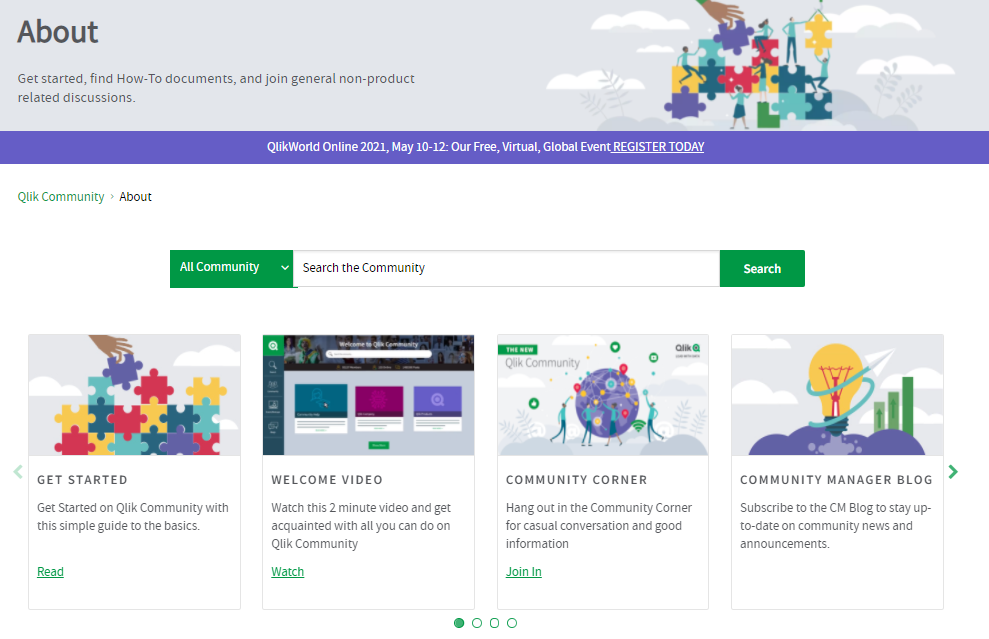
Qlik Community
Get started on Qlik Community, find How-To documents, and join general non-product related discussions.
Qlik Resources
Direct links to other resources within the Qlik ecosystem. We suggest you bookmark this page.
Qlik Academic Program
Qlik gives qualified university students, educators, and researchers free Qlik software and resources to prepare students for the data-driven workplace.
Recent Blog Posts
-
Qlik Academic Program grows in Vietnam
Vietnam is a diverse country with a rich cultural heritage. It’s a country of more than 96 million people and is a prominent country in the South East... Show MoreVietnam is a diverse country with a rich cultural heritage. It’s a country of more than 96 million people and is a prominent country in the South East Asian region.
The education landscape of Vietnam is quite large and consists of more than 400 Universities and colleges with more than 2 million students pursuing university studies. Universities are either specialized or multidisciplinary and offer bachelor, professional, master, and doctoral degrees.
Qlik Partner Aufinia has been supporting the growth of the academic program in Vietnam. With its growing list of clients, they require interns to work on client projects and since the academic program offers a complete suite of resources for students to get trained and qualified on Qlik Sense, this takes their effort on having to search for the right students, train and on board them for their projects.
So far, students and Professors from the University of Technology (UIT), Royal Melbourne Institute of Technology University ( RMIT) have registered for the Qlik Academic Program. In due course, the British University students would also be registering into the program.
This symbiotic relationship is helping students get trained on world class analytics resource of Qlik and an opportunity to work on real life projects. This is also an example of how the internal Qlik ecosystem can work together to expand the larger mission of Qlik of data literacy.
While this is only the beginning of the academic program in Vietnam, it promises to grow further.
For more information about the Qlik Academic Program, visit qlik.com/academicprogram
-
Get your API fix with the new developer changelog on qlik.dev
Hi all,Since the release of qlik.dev earlier this year, the developer platform team has added several features month after month, increasing the overa... Show MoreHi all,
Since the release of qlik.dev earlier this year, the developer platform team has added several features month after month, increasing the overall usability, accessibility, and variety of information on the portal website (see: qlik.dev fall update wrap-up.)
And this month is no different. Along with the usual additions of tutorials, the team has been working on providing an update to the way developers, integrators, and business users consume information related to Qlik's open API platform. Until now, the way you consumed API updates - that is found out about new APIs, changes to existing APIs, and deprecations - is through the API Insights Qlik app. This app provided a way to compare API changes between versions of Qlik Sense but it was very technical. One thing it lacked was context, impact, and timing for when API changes arrived.
Today, we're changing the paradigm to better reflect the software company Qlik has become and will mature into the future.
Introducing the qlik.dev developer changelog. The developer changelog is the new way we are going to communicate updates and changes to Qlik's APIs, introduce tutorials for integration-centric features, and guide you through our ever evolving developer journey.
A screenshot of the qlik.dev developer changelog
The changelog works by monitoring changes in APIs processed through our API governance machinery. When an new API becomes public, the changelog will communicate it. When an API changes, the changelog will help you assess the impact of the change on your solutions. And when we announce deprecation of an API, the changelog will inform you when the API will no longer be available, and how to remediate or refactor your solutions to support a replacement.
In addition, the changelog will announce new releases of developer platform tooling the team provides through Qlik Open Source, and presents another channel for the team to communicate important technical information you want to know regarding Qlik's API strategy. As I mentioned before, the changelog is live today! And while it may not have too much to report at this point, expect a steady stream of updates the rest of this year and well into 2021.
You may be wondering, what's happening to API Insights? In the world of SaaS, change is constant and sometimes rapid and we want to make sure we’re sharing information with you in an open and straightforward way. To that end, the API Insights Qlik Sense application is heading into retirement. The final update of the API Insights app includes Qlik Sense Client Managed Windows September 2020. No more updates to the app are planned. The site, https://api-insights.qlik.com will remain available until the end of 2020. Beginning today, you can download all the qvf files that comprised the API Insights mashup here
If you have questions about the changelog or API Insights, please leave a comment below and we'll get back to you. On behalf of the Developer Platform team, thank you for your continued support and constant push to provide the best developer experience in analytics.
Cheers!
jg
-
Upskill in data literacy this summer with our free courses for students
Hands on experience with Qlik Sense - our industry leading analytics software. You get free access to both the cloud and desktop version, along with i... Show More- Hands on experience with Qlik Sense - our industry leading analytics software. You get free access to both the cloud and desktop version, along with interactive training videos and other learning resources. If you’re brand new to Qlik, the Business Analyst New User Learning Pathway is a great place to start. You’ll be building data visualisations and discovering insights in your data in no time!
- Once you have mastered your Qlik Sense skills you can also earn yourself a qualification to show off your new skills to future employers. If you pass successfully you will earn yourself a digital certificate and badge that will look great on your CV or LinkedIn profile.
- If you are keen to learn all things data literacy we have a wealth of data literacy courses available to you. These cover everything from the importance of a culture of data literacy in organisations, to data informed decision making.
- If you want training in the theories and concepts behind data visualisations and data analytics, we have that too! Our Data Analytics Curriculum provides product agnostic training on topics such as the psychology of design, data storytelling, data fundamentals and more!
- Last but by no means least, our free Data Literacy Certification measures your ability to interpret business requirements, understand and transform data, work with visualisations and act on results. And the Data Analytics Certification measures your analytic and statistics knowledge. To find out more about the prerequisites and recommended preparation for these courses visit our certifications section.
To see a demo of all of these resources check out this short video.
All of the above is completely free to students and educators at all accredited universities globally. So make the most of your time this summer and get signed up for the Qlik Academic Program today! -
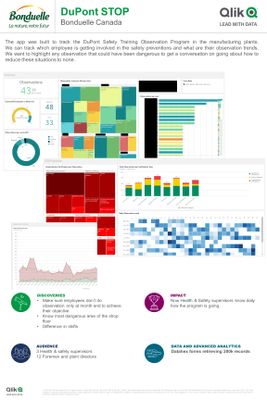
Bonduelle - DuPont STOP
The app was built to track the DuPont Safety Training Observation Program in the manufacturing plants.We can track which employee is getting involved ... Show MoreThe app was built to track the DuPont Safety Training Observation Program in the manufacturing plants.
We can track which employee is getting involved in the safety preventions and what are their observation trends.
We want to highlight any observation that could have been dangerous to get a conversation on going about how to reduce these situations to none. -
Accelerate your Data Literacy and Data Analytics skills
Qlik Education has launched this new blended learning course Applied Data Analytics using Qlik Sense and it is unlike any course we have ever offered.... Show MoreQlik Education has launched this new blended learning course Applied Data Analytics using Qlik Sense and it is unlike any course we have ever offered. It’s a university-style, 15-week course that allows you the freedom to learn at your own pace, consuming smaller bits over a longer timeframe, and have an instructor on-hand who can help guide you through and answer your questions.
This unique delivery approach will provide you with a collaborative learning environment led by our expert instructors including shared experiences with other customers. This is a hands-on course which includes, live virtual instructor-led sessions, self-paced learning, interactive forum discussions, reinforcement quiz checkpoints, lessons and activities with data sets, business cases and an activity-building project due at the end of the course.
By completing this course, you will learn topics relating to data analytics, data literacy, and data-informed decision-making. You will obtain knowledge on topics addressed in our Understanding Data Principles and Create Visualizations using Qlik Sense courses.
You will also obtain the knowledge to be able to take the Qlik Sense Business Analyst Qualification, Data Analytics Certification and Data Literacy Certification.
Check out Course Datasheet for more details, and experience the course for yourself by viewing the first week of this course.

-
Vizlib - Project Planner
Plan your projects across multiple groups and phases to stay on track! Quickly see tasks to complete, explore the live Gantt view, collaborate with yo... Show MorePlan your projects across multiple groups and phases to stay on track!
Quickly see tasks to complete, explore the live Gantt view, collaborate with your co-workers using Teamwork, and even update task progress, milestones, and more with Writeback. Vizlib Tiles is even used to create a Kanban-style board for tasks. Move from read-only project plans into a living project planning tool to help you run smoothly. Works with data from JIRA, Microsoft Project, etc. Or build your entire project data set in the Qlik application using writeback. No need for an external planning tool.
Download the app (.QVF): https://home.vizlib.com/apps/project-planner/
Vizlib Project Planner

-
And the Winner Is...
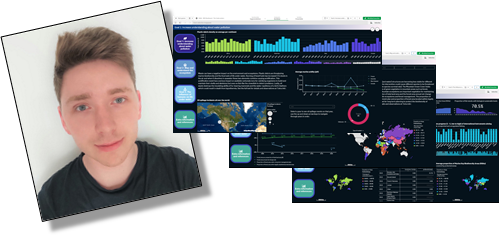
Congratulations to Jesse van Haasteren, team Codecrackers from Universiteit Leiden in the Netherlands for winning our 2021 global Qlik Academic Progra... Show MoreCongratulations to Jesse van Haasteren, team Codecrackers from Universiteit Leiden in the Netherlands for winning our 2021 global Qlik Academic Program QlikWorld Datathon!
Back in February Qlik launched a Datathon, a challenge to help develop solutions towards achieving the United Nations 17 Sustainable Development Goals. We invited Qlik Academic Program students from across the globe to use Qlik software to develop data and analytic solutions for the global challenges we face including poverty, inequality, climate change, environmental degradation, peace and justice. Students were able to design their solution based on the challenge objectives and three finalists were announced in April. During the three-day event, QlikWorld Online participants had the opportunity to watch presentations by each of our three Datathon challenge finalists and then vote for their favorite. The votes are in and team Codecrackers was chosen as the winner! Read here for more details about team Codecrackers and their journey. If you were unable to attend QlikWorld Online, it is not too late to watch the Datathon presentation. If you are interested in participating in a future Datathon or would like to join our program, register today for the Qlik Academic Program and receive free access to our software, training and other learning resources!
Congratulations again Jesse!
-
Registering for Events via Qlik Community
Qlik Community is more than just your average online community. We are a true 'hub' destination wanting to connect our members to other members but a... Show MoreQlik Community is more than just your average online community. We are a true 'hub' destination wanting to connect our members to other members but also to help you navigate the Qlik ecosystem. Over the past two years we have seen a massive spike in interest that the community be more than just Q&A. While we certainly get that you come here primarily to have questions answered there is more to do here.
This article is focused on raising awareness to the Events area within the Qlik Community. Plus I hope to leave you with a laugh or two. Read on members!
I'll fill you in on a little secret, we do NOT promote ALL Qlik events on the community. In fact, many that hit our desk are just not a good fit. We make daily decisions on which events to promote here and have no intention to bombard you with content just because we have a page to do it.
If you have not yet visited our Events and Webinar page, please do - you may uncover something of interest. You can subscribe to the page to receive notifications. Tell us what you think of the Events & Webinars page in the comments- the good, the bad, the ugly - we can handle it! In the future we plan to connect the dots better; the intent is to bring event information to the forums where you spend your time - with no need to subscribe elsewhere.
Speaking of events, have you registered for QlikWorld Online 2021 yet? We wish we could see you in person this year but it is what it is. What I can tell you with certainty is this... the Qlik Events team put their heart and soul to ensure an incredible event experience. So register now if you haven't already.
Register here for QlikWorld Online 2021
To prepare for QlikWorld I was asked to prepare a video 😲 for the Qlik Community booth. While I have to save the final video for the actual event I can share my BLOOPER video 🤣🤣 If you can't laugh at yourself who can you laugh at?
See you online !
Melissa Potvin
Director, Qlik Community
-
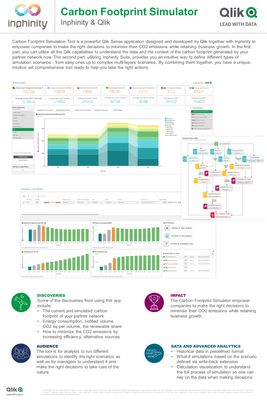
Inphinity & Qlik - Carbon Footprint Simulator
If you'd like to know more, let us know. 😉 -
QlikWorld 2021 May 10-12, 2021 Free Virtual Event
Whether you live and breathe data or you’re just starting out, QlikWorld will accelerate your data integration and data analytics expertise.Expand You... Show MoreWhether you live and breathe data or you’re just starting out, QlikWorld will accelerate your data integration and data analytics expertise.
Expand Your Data Knowledge
From keynotes to success stories and super-fresh ideas, QlikWorld will renew your passion for data. Hear from the world’s leading data experts and BI analysts, and leave inspired with new ideas and approaches to transform your approach to data integration and data analytics.
Be on the Leading Edge of Business IntelligenceThe next era of business intelligence is here. Get blown away with new capabilities and enhancements that will help you activate your data and accelerate business insights like never before. Discover what Active Intelligence means for you and how Qlik can help you achieve it.
Network with Data Enthusiasts and BI ExpertsVirtually connect with thousands of data enthusiasts and BI experts from around the globe to explore solutions, ideas and best practices. No matter where you join us from – your desk, your couch or your favorite spot - you can make new connections while getting all your most pressing data questions answered.
Be Inspired by Data ProfessionalsGet a front row seat to award winning author Malcolm Gladwell, change-making social advocates like Yassmin Abdel-Magied, and data innovators like Qlik’s Chief Product Officer James Fisher as well as over 80 other data professionals and thought leaders. Attend, hear from them firsthand, and walk away motivated to rethink your approach to data like never before.
Be a part of something biggerDiscover how data is helping with everything from COVID-19 vaccine distribution to fighting the impacts of climate change and much more.
-
Join me for a live Academic Program webinar
Join me live to learn more about the Qlik Academic Program, supporting university students and educators around the world!Date: Thursday, May 13thTime... Show MoreJoin me live to learn more about the Qlik Academic Program, supporting university students and educators around the world!
Date: Thursday, May 13th
Time: 11am EST
Can't make it? Register and we will send you the recording!

-
Ideation and QlikWorld - A Unique Experience
Are you familiar with Qlik’s Ideation Program? Did you know you can influence the direction of our product roadmap based on your unique use case? Chec... Show MoreAre you familiar with Qlik’s Ideation Program? Did you know you can influence the direction of our product roadmap based on your unique use case? Check out Qlik Ideation, a program where Qlik collects and analyzes feedback from our community of product enthusiasts to help shape product direction based on real customer requirements.
Our Ideas forum located at community.qlik.com operates as a collaborative social platform, designed to be interactive, effective, and enjoyable for users. The ideas board is visible to everyone on Community and allows idea submissions from customers and partners who are community members. Even better, you have the opportunity to directly connect with our team of Product Managers to engage in discussions and further explore the details of your idea.
Watch this video for information on how to submit an idea, how to view and vote for existing ideas, and how to keep an eye on the statuses in community and track deliveries.
Our Product Management team utilizes an internal Qlik Sense App to track and review the ideas from the forum. We use the power of Qlik Sense to analyze the valuable input on what our customers are requesting, allowing us to gain insights on how to make our customers more successful with the use of our platform. This app associates the ideas, labels, tags, kudos, comments, and more from our community area, and organizes them into a dashboard tied to specialty of our Product Managers for exploration and analysis. Product Managers can see the ideas assigned to them, access the link directly from the app, track trending or top ideas, and follow-up with ideas that are closed or collecting feedback – which provides them the opportunity to connect with our customers.
In the past quarter, we have been prioritizing promotion of Idea delivery
to close the loop between our product releases and our Idea collection. A key feature recently implemented was the bidirectional workflow to the community area from Qlik Sense SaaS in the “What’s New” area within Connect & Learn, where you can see implemented features that were sourced from Ideation - marked with an Ideation badge - to drive awareness on the program and our commitment to customer success. Within Qlik Sense SaaS, you can also access the community forum and tutorial video directly, for a more integrated approach to collect your valuable ideas. Delivered ideas currently make up over 25% of ideas closed, and it is important to Qlik to share how we consider your feedback, as it will support the success of the program.
Next week at QlikWorld we are excited to share a unique experience for Ideation, where attendees will be able to browse and vote on a several key ideas that are currently “collecting feedback”. Visit the Data Integration, Data Analytics, and Active Intelligence booths in the Virtual Expo Center at QlikWorld to access the Ideation spaces and cast your vote on key product ideas. We are also welcoming feedback for the Ideation process as part of the survey, and live chat with us will be available in the Expo Centers.
Please Register for QlikWorld and visit us on Monday!
See you there,
Meghann MacDonald
-
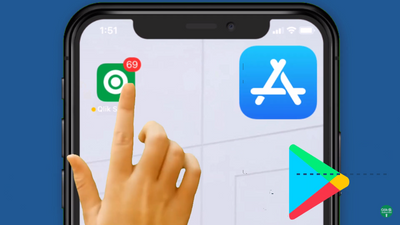
Introducing Qlik Sense Mobile for SaaS – Analytics at the point of Decision.
Mobility has become table stakes for companies looking to gain competitive advantage in the information economy, and many workers rely almost complet... Show MoreMobility has become table stakes for companies looking to gain competitive advantage in the information economy, and many workers rely almost completely on mobile devices to get the answers they need. With this new app, we are continuing to invest in new ways to expand our analytics beyond the dashboard.
As folks know, Qlik Sense is already mobile, delivering a complete set of mobile capabilities with responsive design and touch interaction in our web client. Now, SaaS users can leverage a native app for iOS and Android that enhances their user experience even further, and with the Qlik Associative Engine running on-device, supports fully interactive online and offline exploration. The app also features integrated alerting with push notifications, so users can be notified of important changes in their data and respond in real-time. And of course, it provides best-in-class security and governance for data, applications, and users.
With Qlik Sense, users can truly harness the power of analytics directly at the point of decision, delivering answers to unanticipated questions and driving action in real-time. So while mobile BI has been around a long time, true mobility for your data is now possible.
Qlik Sense Mobile - Demonstration
Click here for the video transcript.
Get the App!T
oday’s release also includes a new SharePoint connector which allows QSE SaaS users to browse the Office 365 SharePoint hierarchical structure to access Qlik Sense Supported Data files.
For additional information on our recent SaaS enhancements, subscribe to the RSS SaaS Change log on our help site, and register for the Qlik Insider for a complete product update across our Data Integration and Data Analytics portfolio.
-
Qlik Learning Portal User Tours
With all the great content we offer, we understand that knowing where to start might not be apparent right away. We have built walk-through tours tha... Show MoreWith all the great content we offer, we understand that knowing where to start might not be apparent right away.
We have built walk-through tours that guide the first-time user through the most important areas and where to get started based on your learning needs. If you haven’t seen our guided walk-through, log into the Qlik Learning Portal and check it out!
Note: If you have already seen the tour and would like to activate it again, select the “Reset user tour on this page” link in the footer menu of the page.
-
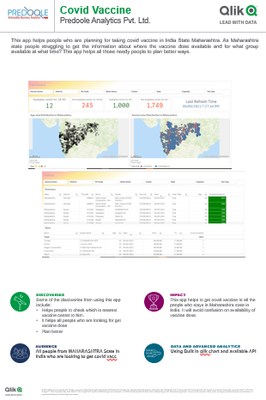
covid vaccine availability in Maharashtra
This apps helps people to get better decision on how, where and at what time to get vaccination. It also helps to people to identify which is nearest ... Show MoreThis apps helps people to get better decision on how, where and at what time to get vaccination. It also helps to people to identify which is nearest location from them get vaccination.
-
Community Enhancements (2021 - 3)
Hi Members, In our May 2021 Release we offer a number of enhancements to our Qlik Community. In fact, it's one of my favorites in a while. Before I... Show MoreHi Members,
In our May 2021 Release we offer a number of enhancements to our Qlik Community. In fact, it's one of my favorites in a while. Before I dive into all the updates I want to remind you to register for QlikWorld. With only a few days left to go, now is the time to register. If you look at the top of this page you will see a link to register on the Announcement bar. You can also just follow this link --> Register to QlikWorld. It's going to be great this year and we can't wait to see you there! Hopefully next year we can meet again face to face! 🤞
Community Enhancements:
1. Qlik Gallery
The Qlik Gallery has really taken off and we are thrilled you are enjoying to share your app journey with others. Your app need not be 'perfect' or 'complete', in fact we recommend you share your journey and progression with us. Share your encouragement with others too; it only takes a moment to write a comment and say "Wow that is impressive!" or to ask "How did you do that?" We have updated the Gallery page with a new look and feel and we hope you love it!The best part.... if you share your app you earn a Community Badge!
For members that have already published an app, simply login- and then (and only then) will your badge will be distributed to your profile. Here is what the badge looks like.
2. 'About' Page
A popular destination, especially with new members, the 'About' page also received a facelift and we are loving how the use of the carousel really elevates all the different areas you can visit. Did you know...The Community welcome video features the faces of many of our MVP's!If you scroll right on the carousel you will find a brand new page for Featured Members!
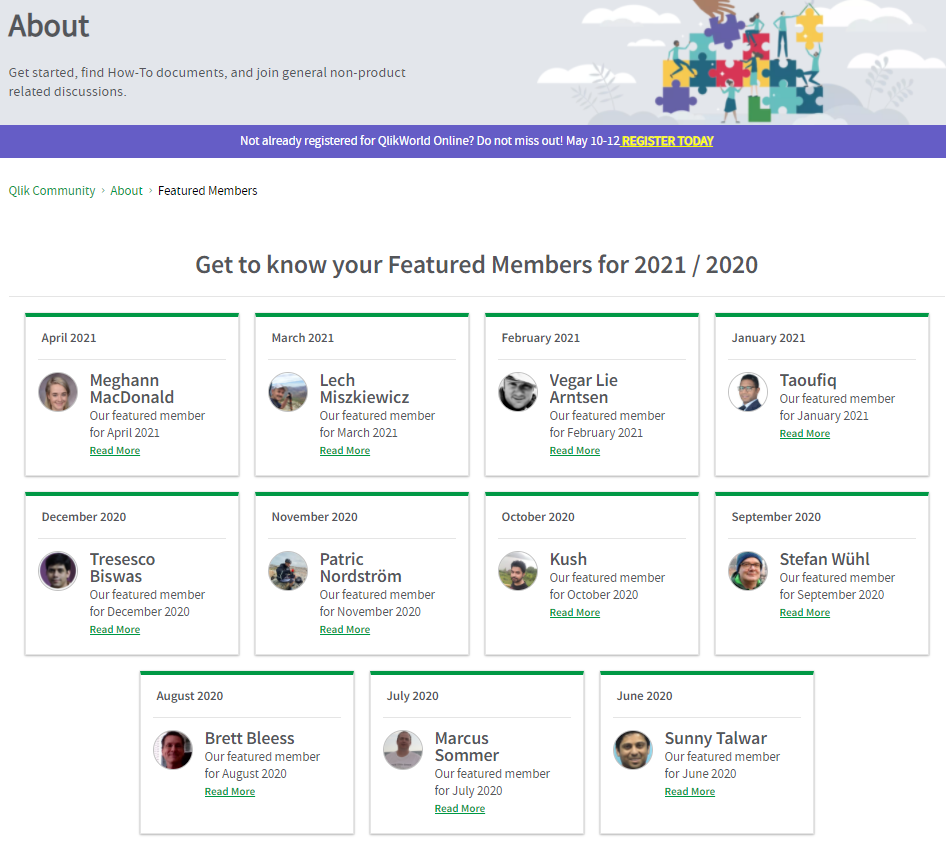
3. Featured Members!
Every month @Sue_Macaluso publishes an article featuring one member in our Qlik Community. Our featured member will be highlighted on the home page of the community (as usual) while this page allows us to showcase all members that have received the same recognition. Hats off to all our Featured Members! We are grateful for all you do day in and day out.4. Related Content
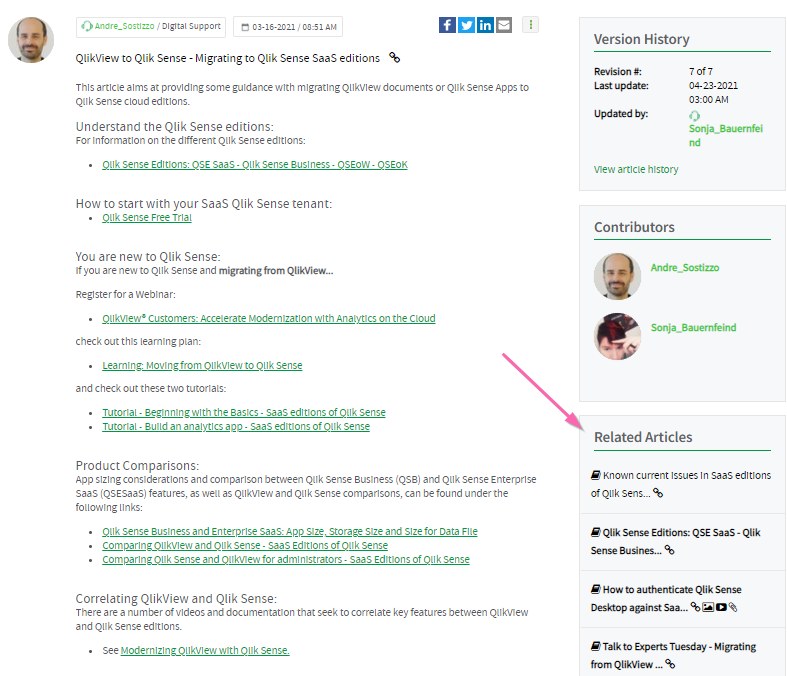
Enabled sitewide and on all Document boards, we've added an out of the box component that will allow you to see 'related' content. Let's watch this closely together to make sure it is actually delivering content as it is intended. You can share your feedback with us in the Community Corner. The related content will appear on the right hand nav once you open an article.5. Release Notes (v2)
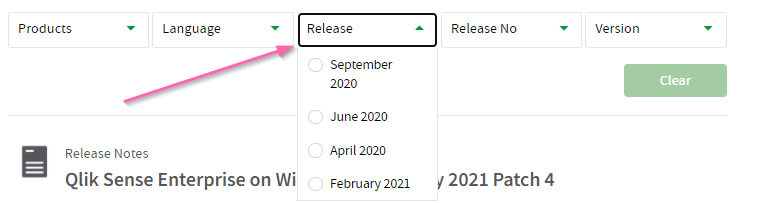
A new field "Release Name" has been added to the Release Notes page to allow you more opportunity to search and find what you are looking for. Release Notes is a new addition to the Qlik Community and used to reside on the Download site. We will continue to make iterative improvements to this page over time.6. New Forum for Insight Advisor
Insight Advisor in Qlik Sense® delivers a new breed of AI that creates a powerful synergy between human intuition and machine intelligence. You can learn more about it on Qlik.com. You can find the forum under Data Analytics.7. Data Integration: Document Board Consolidation
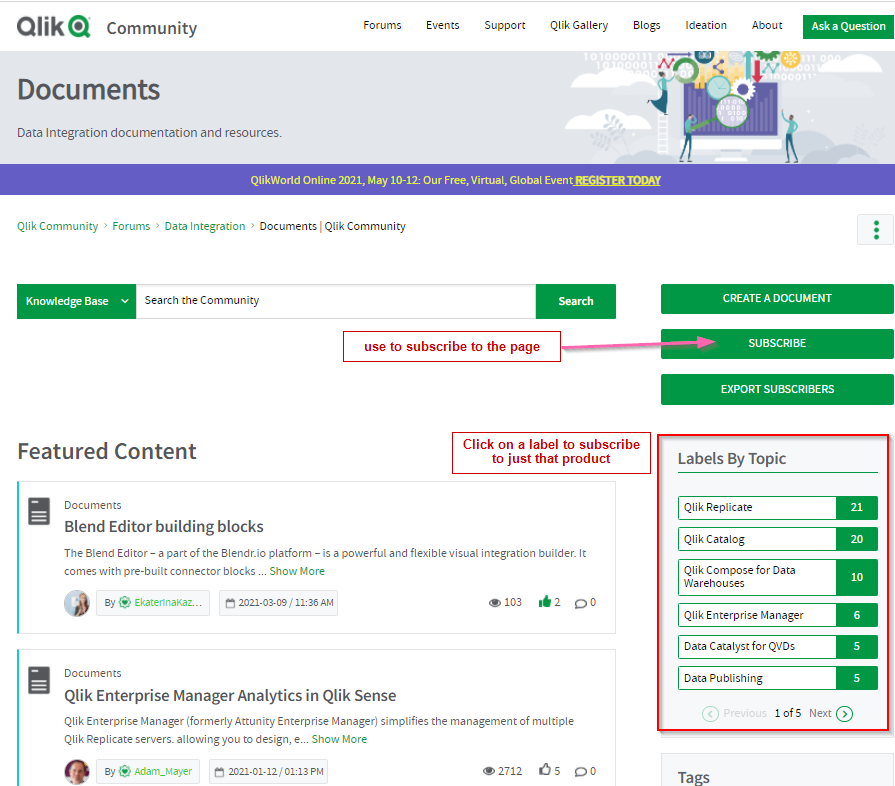
Within the Data Integration forums we have consolidated down the document boards from 7 to 1. Through use of labels you can drill down to the respective product and subscribe only to that content.We hope you enjoy all of this months updates. So much more is coming your way including a major rollout for the Qlik Greenway.
Get Excited.. this will be EPIC !
We hope all our members are staying safe and healthy in these tumultuous times.
All the best,
Your Qlik Community Team
-
Connecting Multiple Calendar Date Fields in a Qlik Sense App Using Linked Tables
In today's blog and video, Qlik Solution Architect Tomilayo Komolafe (Tomi) is back providing real in-the-trenches solutions to real customer problems... Show MoreIn today's blog and video, Qlik Solution Architect Tomilayo Komolafe (Tomi) is back providing real in-the-trenches solutions to real customer problems.
- How does one do analysis with multiple date fields?
Here is the scenario:
- Customer had multiple date fields
- One primary key is related to multiple date fields
I was recently working with a prospect in the quality assurance (QA) space. The customer had an interesting problem on his hands. Whenever a QA event arises in his team, a QA number is generated. However, each QA #, at some point, would have a Date Identified, Date Initiated, Date of Occurrence, and Date Closed field. He was stumped on how to perform analysis on his data with these multiple date fields. For example, if he wanted to know how many events were Identified, Occurred, and Closed, in August 2020, how could he do this? He knew he would need some arbitrary master calendar that connects all these date fields together. (For a great explainer video on Master Calendar - check out this video from my colleague Mike Tarallo . It is slightly older but still valid in this scenario and explains the Master Calendar concept in an easy to understand manner. )
NOW....that’s not all, my customer still needed a way to relate all the four date field types to the master calendar. We resolved his problem using Link Tables and my video below goes through how this can be implemented. In this example, I am playing the role of a retailer, think of Amazon, whom for any order generated with some Order ID number, there would be multiple dates related to this order. The dates here are OrderDate, InvoiceDate, ShippedDate, and ArrivalDate. Watch how easy Qlik makes analyzing this data set easy.
Watch this video to learn more and see how we solved it:
Can't see the video? YouTube blocked by your region or organization? Download the .mp4 files to watch on your computer or mobile device.
See more of Tomi's posts:

-
Getting all data cells from app.createCube()
As I was working on one of my latest mashups, I had a task, to get all cells with numerous sets of dimensions and measures, with a HyperCube out of Ql... Show MoreAs I was working on one of my latest mashups, I had a task, to get all cells with numerous sets of dimensions and measures, with a HyperCube out of Qlik Sense. The worst part is that one of my sets, had a total of 3+ million cells!
We know that the initial HyperCube returns only up to ~10k cells, So the question is how do we paginate to get the rest or even get them all in one call!
We also know that, most of the Capability API methods are using promises, something very helpful, especially if we make a lot of calls to Qlik Sense and expect to return the results only when all of the promises have been resolved. This is where promises “.all()” come into play.
Even though ES6 has promises build in, not all browsers support it yet, so I will use Angular's $q to handle those promises.
First we have to make the initial call and get the maximum rows and columns. We start by creating the cube with the dimensions
app.createCube({
qDimensions : qDimensions,
qMeasures : qMeasures
}).then(function(model) {
Once we have the model ready, we make the initial call to get the first set of results and get the HyperCube info like total columns and total rows
model.getHyperCubeData('/qHyperCubeDef', [{qTop: 0, qWidth: 20, qLeft: 0, qHeight: 500}]).then(function(data) {
Once we have that we can determine how many total pages do we have
var columns = model.layout.qHyperCube.qSize.qcx;
var totalheight = model.layout.qHyperCube.qSize.qcy;
var pageheight = Math.floor(10000 / columns);
var numberOfPages = Math.ceil(totalheight / pageheight);
Now, if we got all of the results, we should end the method and return those results
if (numberOfPages==1) {
deferred.resolve(data.qDataPages[0].qMatrix);
}
Otherwise, we should get the data from all pages and then return the results! Promises in full glory!!!
var Promise = $q;
var promises = Array.apply(null, Array(numberOfPages)).map(function(data, index) {
var page = {
qTop: (pageheight * index) + index,
qLeft: 0,
qWidth: columns,
qHeight: pageheight,
index: index
};
return model.getHyperCubeData('/qHyperCubeDef', [page]);
}, this);
Promise.all(promises).then(function(data) {
for (var j=0; j<data.length; j++) {
for (var k=0; k<data.qDataPages[0].qMatrix.length; k++) {
qTotalData.push(data.qDataPages[0].qMatrix)
}
}
deferred.resolve(qTotalData);
});
This is how we get all of the results for a given set of Dimensions and Measures.
If you want to paginate just create a function that passes the page+1*500 to the qInitialDataFetch like
app.createCube({
qDimensions : qDimensions,
qMeasures : qMeasures,
qInitialDataFetch : [{
qTop : (pageIndex)*500,
qLeft : 0,
qHeight : 500,
qWidth : 20
}]
}, function(reply) {
Or
model.getHyperCubeData('/qHyperCubeDef', [{qTop: (pageIndex)*500, qWidth: 20, qLeft: 0, qHeight: 500 }]).then(function(data) {
-
Presenting Datathon Finalists Team Qlik Boom!
The team is made up of Hari Vignesh and Lok Hin Cheng, both are currently studying a Master of Business Analytics and Big Data degree at the Universit... Show MoreThe team is made up of Hari Vignesh and Lok Hin Cheng, both are currently studying a Master of Business Analytics and Big Data degree at the University of Liverpool in the UK. Hari is from Chennai in South India, which is where he studied for his bachelor’s degree. Following that he worked for Groupon as a customer analyst for 2 years and then spent 3 years at McKinsey & Company as a visual analyst. In November of 2020, he embarked upon his master’s course and made the move to live in Liverpool just a few weeks ago. Lok Hin is originally from Hong Kong but studied for his bachelor’s in Canada before working in a bank for 3 years focusing on loans and trade finance.
Lok Hin Cheng
Hari Vignesh
After finding out about the Datathon in a guest lecture by Qlik, Lok Hin approached Hari to see if he would be interested in entering the datathon as a team. “I was particularly interested in participating as a team, as I enjoy working with others. I believe that you can learn a lot from complementary strengths, and an alternative approach from my own teammate can often spark new ways of thinking for me,” commented Lok Hin.
Hari was also keen to participate in the datathon and despite only having met Lok Hin virtually in a study group he was eager to partner up. “Over the course of the datathon, I was in the final stages of preparation for my move from Chennai to Liverpool, so time management was key to making sure that our application was ready to meet the deadline. The time difference between the UK and India was also a challenge so we were truly an international team,” said Hari.
Both Lok Hin and Hari really enjoyed taking part in the datathon as it gave them the opportunity to practice their Qlik Sense skills using a large, real-life data set. Prior to the Datathon Lok Hin had taken the Business Analyst Learning Plan that was available to him via the Qlik Academic Program. Now that they have had the opportunity to really practice their Qlik Sense skills in the datathon, both are keen to take the Business Analyst qualification as well as more advanced learning modules in Qlik to develop their expertise.
The app that they have developed encompasses all 17 of the United Nations Sustainable Development Goals and looks at how the goals are interconnected. The idea being that if you are trying to work towards one goal e.g. education, there are other goals e.g. industry, innovation, and infrastructure that will impact your progress. The app enables users to explore the progress of countries with different profiles towards each of the goals and to see how progress towards one goal can affect another. You can see a full presentation of the app by Lok Hin and Hari as well as the other finalists at QlikWorld, where you can vote for the overall winner.
Team Qlik Boom initially decided to take part in the datathon simply to learn and to have fun. But now they see presenting at Qlik World as a great opportunity to network and to further improve their knowledge of Qlik and analytics more broadly. Both are hoping that this experience will help them to continue on their chosen career paths after their master’s. Hari is shaping his career to help organizations solve problems and improve business performance as a management consultant across a broad range of industries, and Hin is considering a data analytics career in areas such as agricultural technology and investment banking.
Yuanzhu Zhan, lecturer on the Big Data Management module at the University of Liverpool who introduced the students to Qlik commented: "This event offers students an excellent opportunity to handle uncertainty and implement their new ideas of achieving the United Nations 17 Sustainable Development Goals. It was so encouraging to see our students apply data analytics to identify real social problems and come up with solutions."
To see the datathon finalist presentations at Qlik World sign up for your free seat here: https://www.qlik.com/qlikworld/. And if you would like more information about the Qlik Academic Program for University students and educators please visit qlik.com/academicprogram.
-
Introducing Dongsheng Yuan, Qlik Academic Program Datathon Finalist!
I feel extremely pleased to introduce and share about one of the three finalists of the Qlik Academic Program Datathon, Dongsheng Yuan! Dongsheng is ... Show MoreI feel extremely pleased to introduce and share about one of the three finalists of the Qlik Academic Program Datathon, Dongsheng Yuan!
Dongsheng is pursuing his Master of Science from the University of Liverpool, majoring in Big Data.
He feels data analysis is one of the most important skills for his career and in his words, "data analysis technologies are able to transfer “chaotic data” into useful information. By the help of it, we can foresee what will happen in the future, just like a watcher. It is really cool!"
Dongsheng has participated in various projects in data analytics and among them is a data and algorithm competition held by Tencent in 2019. A major requirement in this competition was to build a strategy to select key opinion roles. That was his first opportunity to work on Tensorflow and Linux. He along with his teammates participated in this competition. Although they lost in the first round, it was a great learning experience in the field of data mining, almost like an adventure! This was the turning point that made Dongsheng want to explore further in data science.
For Dongsheng, the journey for the Datathon began when Qlik Academic Program EMEA Lead, Lucy Bannister was invited to introduce the Qlik Academic Program and the Datathon. This sparked his interest in Qlik because he felt it is a powerful, yet convenient technology. As a student in the data field, having used many tools including Python, SQL, even C++, etc., Dongsheng experienced that Qlik could do all this without scripts. The most impressive feature he felt was finishing a lightweight visualization application on Qlik in only 30 minutes, which otherwise required half a day using Python or R. This further ignited his interest in the academic program and he decided to take part in the Datathon.
Dongsheng took about three days to learn to about the basic features of Qlik Sense such as charts, button, animation etc. He discovered that using scripts in application would make it more attractive. He liked the videos in the academic program, which he feels are great.
Dongsheng says, "The experience of taking part in the Datathon helped me a lot. It provided me with a chance to deal with data about the UN Sustainable Development Goals. And for the past weeks, I have been getting familiar with the visualization techniques. Furthermore, I can handle Qlik Sense now, which means that I can finish a lightweight data related mission within 30 minutes! Those experiences and techniques would be powerful weapons in my career"
Dongsheng plans to be a data analyst and wants to work in a gaming company because he likes playing video games and online games. He feels that using data to adjust properties, avoiding overpowered weapons, for example would be great fun to work!
Check out Qlik World to learn more about Dongsheng's goals, view his amazing application, and vote on your favorite!