Unlock a world of possibilities! Login now and discover the exclusive benefits awaiting you.
Search our knowledge base, curated by global Support, for answers ranging from account questions to troubleshooting error messages.
Featured Content
-
How to contact Qlik Support
Qlik offers a wide range of channels to assist you in troubleshooting, answering frequently asked questions, and getting in touch with our technical e... Show MoreQlik offers a wide range of channels to assist you in troubleshooting, answering frequently asked questions, and getting in touch with our technical experts. In this article, we guide you through all available avenues to secure your best possible experience.
For details on our terms and conditions, review the Qlik Support Policy.
Index:
- Support and Professional Services; who to contact when.
- Qlik Support: How to access the support you need
- 1. Qlik Community, Forums & Knowledge Base
- The Knowledge Base
- Blogs
- Our Support programs:
- The Qlik Forums
- Ideation
- How to create a Qlik ID
- 2. Chat
- 3. Qlik Support Case Portal
- Escalate a Support Case
- Phone Numbers
- Resources
Support and Professional Services; who to contact when.
We're happy to help! Here's a breakdown of resources for each type of need.
Support Professional Services (*) Reactively fixes technical issues as well as answers narrowly defined specific questions. Handles administrative issues to keep the product up-to-date and functioning. Proactively accelerates projects, reduces risk, and achieves optimal configurations. Delivers expert help for training, planning, implementation, and performance improvement. - Error messages
- Task crashes
- Latency issues (due to errors or 1-1 mode)
- Performance degradation without config changes
- Specific questions
- Licensing requests
- Bug Report / Hotfixes
- Not functioning as designed or documented
- Software regression
- Deployment Implementation
- Setting up new endpoints
- Performance Tuning
- Architecture design or optimization
- Automation
- Customization
- Environment Migration
- Health Check
- New functionality walkthrough
- Realtime upgrade assistance
(*) reach out to your Account Manager or Customer Success Manager
Qlik Support: How to access the support you need
1. Qlik Community, Forums & Knowledge Base
Your first line of support: https://community.qlik.com/
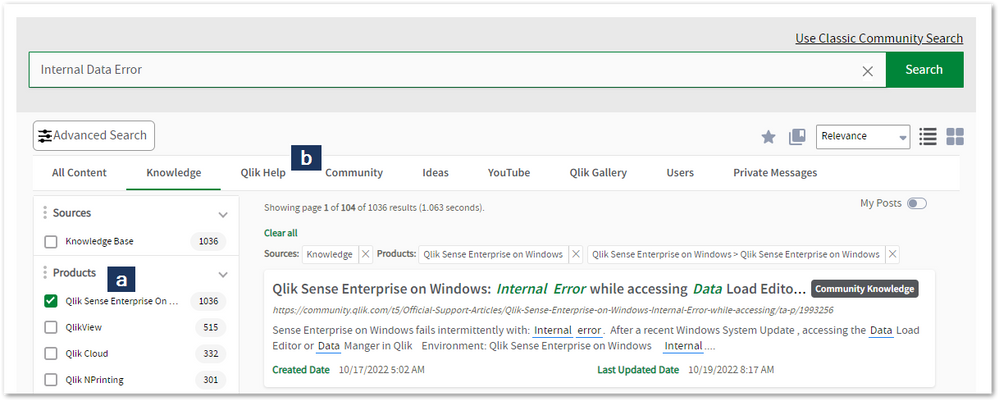
Looking for content? Type your question into our global search bar:
The Knowledge Base
Leverage the enhanced and continuously updated Knowledge Base to find solutions to your questions and best practice guides. Bookmark this page for quick access!
- Go to the Official Support Articles Knowledge base
- Type your question into our Search Engine
- Need more filters?
- Filter by Product
- Or switch tabs to browse content in the global community, on our Help Site, or even on our Youtube channel
Blogs
Subscribe to maximize your Qlik experience!
The Support Updates Blog
The Support Updates blog delivers important and useful Qlik Support information about end-of-product support, new service releases, and general support topics. (click)The Qlik Design Blog
The Design blog is all about product and Qlik solutions, such as scripting, data modelling, visual design, extensions, best practices, and more! (click)The Product Innovation Blog
By reading the Product Innovation blog, you will learn about what's new across all of the products in our growing Qlik product portfolio. (click)Our Support programs:
Q&A with Qlik
Live sessions with Qlik Experts in which we focus on your questions.Techspert Talks
Techspert Talks is a free webinar to facilitate knowledge sharing held on a monthly basis.Technical Adoption Workshops
Our in depth, hands-on workshops allow new Qlik Cloud Admins to build alongside Qlik Experts.Qlik Fix
Qlik Fix is a series of short video with helpful solutions for Qlik customers and partners.The Qlik Forums
- Quick, convenient, 24/7 availability
- Monitored by Qlik Experts
- New releases publicly announced within Qlik Community forums (click)
- Local language groups available (click)
Ideation
Suggest an idea, and influence the next generation of Qlik features!
Search & Submit Ideas
Ideation GuidelinesHow to create a Qlik ID
Get the full value of the community.
Register a Qlik ID:
- Go to: qlikid.qlik.com/register
- You must enter your company name exactly as it appears on your license or there will be significant delays in getting access.
- You will receive a system-generated email with an activation link for your new account. NOTE, this link will expire after 24 hours.
If you need additional details, see: Additional guidance on registering for a Qlik account
If you encounter problems with your Qlik ID, contact us through Live Chat!
2. Chat
Incidents are supported through our Chat, by clicking Chat Now on any Support Page across Qlik Community.
To raise a new issue, all you need to do is chat with us. With this, we can:
- Answer common questions instantly through our chatbot
- Have a live agent troubleshoot in real time
- With items that will take further investigating, we will create a case on your behalf with step-by-step intake questions.
3. Qlik Support Case Portal
Log in to manage and track your active cases in Manage Cases. (click)
Please note: to create a new case, it is easiest to do so via our chat (see above). Our chat will log your case through a series of guided intake questions.
Your advantages:
- Self-service access to all incidents so that you can track progress
- Option to upload documentation and troubleshooting files
- Option to include additional stakeholders and watchers to view active cases
- Follow-up conversations
When creating a case, you will be prompted to enter problem type and issue level. Definitions shared below:
Problem Type
Select Account Related for issues with your account, licenses, downloads, or payment.
Select Product Related for technical issues with Qlik products and platforms.
Priority
If your issue is account related, you will be asked to select a Priority level:
Select Medium/Low if the system is accessible, but there are some functional limitations that are not critical in the daily operation.
Select High if there are significant impacts on normal work or performance.
Select Urgent if there are major impacts on business-critical work or performance.
Severity
If your issue is product related, you will be asked to select a Severity level:
Severity 1: Qlik production software is down or not available, but not because of scheduled maintenance and/or upgrades.
Severity 2: Major functionality is not working in accordance with the technical specifications in documentation or significant performance degradation is experienced so that critical business operations cannot be performed.
Severity 3: Any error that is not Severity 1 Error or Severity 2 Issue. For more information, visit our Qlik Support Policy.
Escalate a Support Case
If you require a support case escalation, you have two options:
- Request to escalate within the case, mentioning the business reasons.
To escalate a support incident successfully, mention your intention to escalate in the open support case. This will begin the escalation process. - Contact your Regional Support Manager
If more attention is required, contact your regional support manager. You can find a full list of regional support managers in the How to escalate a support case article.
Phone Numbers
When other Support Channels are down for maintenance, please contact us via phone for high severity production-down concerns.
- Qlik Data Analytics: 877-754-5843
- Qlik Data Integration: 781-730-4060
- Talend AMER Region: 1-800-810-3065
- Talend UK Region: 44 800-098-8473
- Talend APAC Region: 65-3163-2072
Resources
A collection of useful links.
Qlik Cloud Status Page
Keep up to date with Qlik Cloud's status.
Support Policy
Review our Service Level Agreements and License Agreements.
Live Chat and Case Portal
Your one stop to contact us.
Recent Documents
-
Qlik Sense Engine Enterprise on Windows: How the memory hard max limit works
The Qlik Sense Engine allows for a hard max limit to be set on memory consumption, which, if enabled on the Operating System level as well, will make ... Show MoreThe Qlik Sense Engine allows for a hard max limit to be set on memory consumption, which, if enabled on the Operating System level as well, will make a best effort to remain below the set limit.
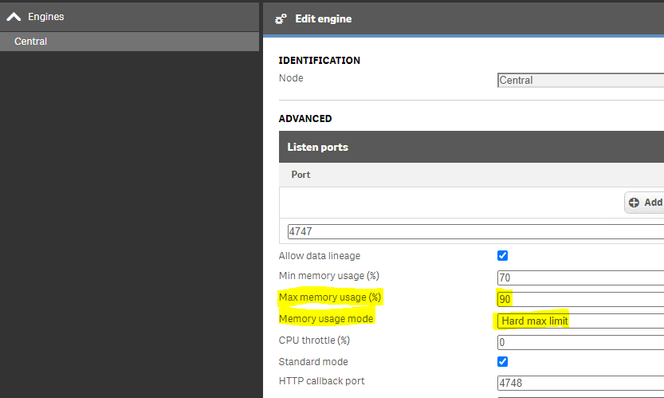
The setting is located in the Qlik Sense Management Console > Engine > Advanced and can be configured as an option in the setting Memory usage mode.
See Editing an engine - Qlik Sense for administrators for details on Engine settings.
- In the drop down list you can choose Hard Max Limit which prevent the Engine to use more than a certain defined limit.
- This limit is defined by the parameter set in percentage called Max memory usage (%)
This setting requires that the Operating System is configured to support this, as described in the SetProcessWorkingSetSizeEx documentation (QUOTA_LIMITS_HARDWS_MAX_ENABLE parameter).
Even with the hard limit set, it may still be possible for the host operating system to report memory spikes above the Max memory usage (%).
The reason for that is because the Qlik Sense Engine memory limit will be defined based on the total memory available.
Example:- A server has 10 GB memory in total and the Max memory usage (%) is set to 90%.
- This will allow the process engine.exe to use 9 GB memory.
- Another application or process may at that point already be consuming 5 GB memory, and this will cause an overload of the system if the engine is set to use 9 GB.
- The engine.exe will not be able to respect other services
The memory working setting limit is not a hard limit to set on the engine. This is a setting that set how much we allocate and how far we are allowed to go before we start alarming on the working set beyond parameters.
Internal Investigation IDs:
QLIK-96872
-
Shared automation connections
The new shared capability for automation connections enables you to create and manage automation connections in shared spaces. At a later stage, we w... Show More -
ODBC connectors stopped working after a Qlik Sense upgrade
Qlik ODBC drivers may fail to load with the error: Error: Connector connect error: SQL##f - SqlState: IM003, ErrorCode: 160, ErrorMsg: Specified driv... Show MoreQlik ODBC drivers may fail to load with the error:
Error: Connector connect error: SQL##f - SqlState: IM003, ErrorCode: 160, ErrorMsg: Specified driver could not be loaded due to system error 126: The specified module could not be found. (Qlik-redshift, C:\Program Files\Common Files\Qlik\Custom Data\QvOdbcConnectorPackage
edshift\lib\AmazonRedshiftODBC_sb64.dll).
ERROR [IM003] Specified driver could not be loaded due to system error 126: The specified module could not be found. (Qlik-redshift, C:\Program Files\Common Files\Qlik\Custom Data\QvOdbcConnectorPackage
edshift\lib\AmazonRedshiftODBC_sb64.dll).The error persists even if the specified "*.dll" exists in the path mentioned in the error description.
More information about the logs can be found in Locate the log files for ODBC connectors Or How To Collect Logs From Qlik ODBC Connector Package
Resolution
The problem is caused by a compatibility issue with the installed ODBC drivers and the installed Microsoft Visual C++ version. Verify that the correct Microsoft Visual C++ version for your ODBC driver version.
Take a backup of Qlik Sense and Qlik ODBC connectors folders.
To solve this, download and install the Microsoft Visual C++ Redistributable Packages from here or install Latest Supported Microsoft Visual C++ Redistributable Package
Ensure you restart the Qlik Sense services or reboot the affected Qlik Sense Windows machine if necessary. If it is a multi-node environment, these changes should be applied to all affected nodes.
The information in this article is provided as-is and is to be used at your own discretion. Depending on the tool(s) used, customization(s), and/or other factors ongoing support on the solution below may not be provided by Qlik Support.
Related Content
Qlik ODBC connectors may not work as expected after a Qlik Sense Enterprise on Windows upgrade
Environment
-
The older patch could not be uninstalled! Please uninstall the patch manually - ...
While uninstalling the Qlik Sense patch, the setup will fail with the below error, The older patch could not be uninstalled! Please uninstall the patc... Show MoreWhile uninstalling the Qlik Sense patch, the setup will fail with the below error,
The older patch could not be uninstalled! Please uninstall the patch manually. This installation will exit.
- Unable to uninstall Qlik Sense Patch during Qlik Sense patch process.
- Unable to uninstall Qlik Sense Patch through "Control Panel > Program > Program and Features > Installed Updates".
The installation log file will read the below,
Error! Validation of: D:\Program Files\Qlik\Sense\\Client\1366.f02a********.css failed: Could not find file 'D:\Program Files\Qlik\Sense\Client\1366.f02a********.css'.
Checking if file D:\Program Files\Qlik\Sense\\Client\1366.f02a********.css is locked...
Qlik Sense Installation logs can be found here, (How To Collect Qlik Sense Installation Log File).
Resolution
- Attempt to uninstall the patch using Unable to uninstall Qlik Sense Patches If uninstallation fails, proceed to step 2.
- Retrieve the missing files from another Qlik Sense Enterprise on Windows environment that is running the same version. You can set up a test installation to obtain these files.
- Replace the corrupted files with the copies from the functional installation located at (%Program Files\Qlik\Sense\\***)
Cause
- Old patch has been broken during the Qlik Sense upgrade
- Multiple attempts to uninstall Qlik Sense patches
Environment
Related Content:
- Unable to uninstall Qlik Sense Patch during Qlik Sense patch process.
-
How to configure observability metrics with Talend Cloud and Remote Engine
You can observe your Data Integration Jobs running on Talend Remote Engines if your Jobs are scheduled to run on Talend Remote Engine version 2.9.2 or... Show MoreYou can observe your Data Integration Jobs running on Talend Remote Engines if your Jobs are scheduled to run on Talend Remote Engine version 2.9.2 or later.
This is a step-by-step guide on how Talend Cloud Management Console can provide the data needed to build your own customized dashboards, with an example of how to ingest and consume data from Microsoft Azure Monitor.
Once you have set up the metric and log collection system in Talend Remote Engine and your Application Performance Monitoring (APM) tool, you can design and organize your dashboards thanks to the information sent from Talend Cloud Management Console to APM through the engine.Content:
- Prerequisites
- Configuring and starting the remote engine
- Get the metric details from the API
- Push metric to Azure logs workspace
- Observable metrics
- Queries and dashboard example
- Report One: A sample report for the number of rows processed by a component within the overall run
- Report Two: A sample report to showcase the average time taken by each component grouped by Job
- Report Three: A sample report to showcase OS memory and file storage available in MB
- Report Four: A sample report to showcase all jvm_process_cpu_load events counted in the last two days, in15-minute intervals
- Azure dashboard
- Pin the reports to the Azure dashboard
- Sample Talend Data Integration Job
- Job structure
- Job details
Prerequisites
This document has been tested on the following products and versions running in a Talend Cloud environment:
- Remote Engine 2.9.2 #182 – downloaded and installed following the instructions in Installing Talend Remote Engine in the Talend Help Center.
Optional requirements for obtaining detailed Job statistics:
- Studio 7.3.1 R2020-07 – downloaded from the Talend Cloud Portal and updated with the appropriate monthly patch
- Republish your Jobs from the new version of Studio to Talend Cloud Management Console
Configuring and starting the remote engine
To configure the files and check that the Remote Engine is running, navigate to the Monitoring Job runs on Remote Engines section of the Talend Remote Engine User Guide for Linux.
Get the metric details from the API
Use any REST client, such as Talend API Tester or Postman, and use the endpoint as explained below.
- Endpoint:
GET http://ip_where_RE_is_installed:8043/metrics/json
8043 is the default http port of Remote Engines. Replace it with the port you used when installing the Remote Engine. - Add a header: Authorization Bearer {token}.
This token is defined in the etc/org.talend.observability.http.security.cfg file as endpointToken={token}. - Example:
GET http://localhost:8043/metrics/json
        Authorization Bearer F7VvcRAC6T7aArU
Push metric to Azure logs workspace
There are numerous ways to push the metric results to any analytics and visualization tool. This document shows how to use the Azure monitor HTTP data collector API to push the metrics to an Azure log workspace. Python code is also used to send the logs in batch mode at frequent intervals. Alternatively, you can create a Talend Job as a service for real-time metric extraction. For more information, see the attached Job and Python Code.zip file.
The logs are pushed to the Azure Log Analytics workspace as “custom logs”.Observable metrics
Talend Cloud Management Console provides metrics through Talend Remote Engine. They can be integrated in your APM tool to observe your Jobs.
For the list of available metrics, see Available metrics for monitoring in the Talend Remote Engine User Guide for Linux.Queries and dashboard example
Report One: A sample report for the number of rows processed by a component within the overall run
Query:
Remote_Engine_OBS_CL
|where TimeGenerated > ago(2d)
|where name_s=='component_connection_rows_total'
|summarize sum(value_d) by context_target_connector_type_s
|render piechart
Chart:
Report Two: A sample report to showcase the average time taken by each component grouped by Job
Query:
Remote_Engine_OBS_CL
|where TimeGenerated > ago(2d)
|where name_s=='component_execution_duration_seconds'
|summarize count(), avg(value_d) by context_artifact_name_s,context_connector_label_s
Chart:
Report Three: A sample report to showcase OS memory and file storage available in MB
Query:
Remote_Engine_OBS_CL
|where name_s=='os_memory_bytes_available' or name_s =='os_filestore_bytes_available'
|summarize sum(value_d)/1000000 by name_s
Chart:
Report Four: A sample report to showcase all jvm_process_cpu_load events counted in the last two days, in 15-minute intervals
Query:
Remote_Engine_OBS_CL
|where TimeGenerated > ago(2d)
|where name_s =='jvm_process_cpu_load'
|summarize events_count=sum(value_d) by bin(TimeGenerated, 15m), context_artifact_name_s
|render timechart
Chart:
Azure dashboard
Pin the reports to the Azure dashboard
Sample Talend Data Integration Job
This section explains the sample Job used to send the metric logs to the Azure log workspace. This Job is available in the attached Job and Python Code.zip file.
Job structure
Job details
The components used and their detailed configurations are explained below.
tREST
Component to make a REST API Get call.
tJavaRow
The component used to print the response from the API call.
tFileOutputRaw
The component used to create a JSON file with the API response body.
tSystem
Component to call the Python code.
tJava
Related Content
-
Call the Qlik Sense QRS API with Python
This article is a guide on how to call the Qlik Sense Repository API using Python. Environments: Qlik Sense any version Python 3.x Prerequisit... Show MoreThis article is a guide on how to call the Qlik Sense Repository API using Python.
Environments:- Qlik Sense any version
- Python 3.x
Prerequisites to host the app on a different server
- Export the certificates from the QMC, provide a password and select platform independent PEM-format in the Export file format for certificates option.
- Copy the client.pem and client_key.pem certificates to the external server where the application is hosted.
The Qlik Sense Repository (QRS) API is a RESTful API, so in order to call it from Python, you would need to use a module such as requests
This can be simply installed using pip:pip install requests
Option 1: Connecting using certificates
Create a python file test.py with the following contents (strings in red should be replaced to match your environment):
import requests

requests.packages.urllib3.disable_warnings()

#Set up necessary headers comma separated
xrf = 'iX83QmNlvu87yyAB'
headers = {'X-Qlik-xrfkey': xrf,
"Content-Type": "application/json",
"X-Qlik-User":"UserDirectory=DOMAIN;UserId=Administrator"}

#Set up the certificate path
cert = 'C:\certificates\clientandkey.pem'

#Set the endpoint URL
url = 'https://qlikserver1.domain.local:4242/qrs/app/full?xrfkey={}'.format(xrf)

#Call the endpoint to get the list of Qlik Sense apps
resp = requests.get(url, headers=headers, verify=False, cert=cert)

if resp.status_code != 200:
    # Returns an error if something went wrong.
    raise ApiError('GET /qrs/app/full {}'.format(resp.status_code))
for app in resp.json():
    print('{} {}'.format(app['id'], app['name']))
The clientandkey.pem file should look like below and contains both private key and certificate in pem format (Certificate and private key can be exported from QMC and it can be merged manually using a text editor)-----BEGIN RSA PRIVATE KEY----- MIIEowIBAAKCAQEAigl7uyMr9zdiyZ4UU99IA15qaR6YisrkAxOEDh9aC5xX8cKX mS++v6JjoIJCItLaAII19ubKylSLQZMfiYNMqKrKQIKH8VqgK8G5H/pAYkvpWuz+ MIp5cT4Xxg8sGNFFygHKVfbYPG6M7IXsqiuydKra1+wcgtqh0HrDfHRjzdImYCOB P8zfVVFc5CbVri8mvtbyWr4BYSNcxbacASXo8VQAi5KNHXn39CsfQUy1YmHckBUe vgMS6LwEks4WOY6FBGJ/0XeL2tgJYM85rHsnQNel5L2v5dVfJduZfOPojknjerZs GqMZH/zfj14E/e/p0r2ilOgGNAV56yJmnFou5wIDAQABAoIBAGDs28bBoaOLboBn 0Zo7FFPZPhrl8vKyGHzYfUd1WEMC2vXVT6Gu1t+05QPVsx7Es3Lb+4yM7iQ4TTgU WHa0jWV5116IyW/91K4k7xq3G/Jpn0fLVYk8Ep4jnYnjKXGbsMdxjmPiWl/EuIt0 VoP+/uXQ+q3XCwYPAsRjD1UaXOIt/rlRWvkr18Sx2OcReaFO7j83a/w61QSgVGN9 F5PA29s2KHPPLzsdFfM1Z9eYYQzySPd0Qh7J5lDtznbiaK2GwI+tTKDN6nAVgbkA OY4fmPyeijQckmcFxpEvJg4E7Spxx+VXmVMma/ro5karL/VrrsCm8h3g19vV0Jn4 zTKBkJECgYEAzq/9vs02FnspPTpcAWaJwrwG71aTqxTT2L/IM0s2BalNtURApO4/ QXJ0LRRenw867xifOLKdOMbRpn7jBYinRDmkbeXDLvhgoXALd50h+FZBhbfs3iRn uu02INvXTgDAUd63MiJKdey8DjET4vvn55AfONPmd2m0su89axFpTcsCgYEAqvh6 Sz1m2/xtXRAgva2uI2PPwqSIO/oPInLNiWIfMrXFrPc8hynU2QSmYnF3KCy/n1c7 i3BjocCEYMnp7spL1RbP79GWrsLvd/homVYo0rl0z0M4JPhEi0VxZO3vpaYqTi3X KGAna6mbiIc8jjeBVni/tY0kX2w8Nr8jZLXWv9UCgYEAklJNVRJ6RBgU7d+u2t74 kAAE+NNV3zvzbfL3jDimmgNtm/IhwaFY7sBUNsXA5uIlWrcXoU/xtgwqx6/0kCpa IBaerZ6HO21jG2by908qiWCnKj83VVx4gwED3OdF2Vb2z/7XuopEJI/f4jwkVAD6 ABkrwVNiSQ9weWydEntVDVkCgYAxeP1KUFY3SfALgeM3f85oBzXTSPDzCgTfHwFC w9XrQpYU2uX05rHkqmfLDLJCOdCpNwDP9JGf+KlVqJe8tWUEIDnDV46Wu2m3+XWr CTd+4pNedkEE0aJj+pA5eHBkKpULUlB0Kn69tLKA60EmlgEjGIXA7zqbMiKqZNzF A6lEkQKBgDJW2RiCRLgsfpWjlYU4ivJDRVA23Ns9LWgvNbYFd8IL1yjYerH+cbG0 8IJqIHjSzhKNgUkPI+Tz67bxBBbDkIr9Eo+GVr/L0ZDuAXZUG2z8M21OnKP5pXMq YgMneRqJgNQ3zeWgWwZSY+ud/0Y+UhB2nGZ++Nt9ZADcPi27g37E -----END RSA PRIVATE KEY----- -----BEGIN CERTIFICATE----- MIIDHTCCAgWgAwIBAgIQAPwSp1uUSsF/FUfzmrDGtzANBgkqhkiG9w0BAQsFADAm MSQwIgYDVQQDDBtRbGlrU2VydmVyMS5kb21haW4ubG9jYWwtQ0EwHhcNMTgwNzEw MDkzNzQ3WhcNMjgwNzE3MDkzNzQ3WjAVMRMwEQYDVQQDDApRbGlrQ2xpZW50MIIB IjANBgkqhkiG9w0BAQEFAAOCAQ8AMIIBCgKCAQEAigl7uyMr9zdiyZ4UU99IA15q aR6YisrkAxOEDh9aC5xX8cKXmS++v6JjoIJCItLaAII19ubKylSLQZMfiYNMqKrK QIKH8VqgK8G5H/pAYkvpWuz+MIp5cT4Xxg8sGNFFygHKVfbYPG6M7IXsqiuydKra 1+wcgtqh0HrDfHRjzdImYCOBP8zfVVFc5CbVri8mvtbyWr4BYSNcxbacASXo8VQA i5KNHXn39CsfQUy1YmHckBUevgMS6LwEks4WOY6FBGJ/0XeL2tgJYM85rHsnQNel 5L2v5dVfJduZfOPojknjerZsGqMZH/zfj14E/e/p0r2ilOgGNAV56yJmnFou5wID AQABo1gwVjAdBgNVHQ4EFgQUHuRgu4W91AWDpUV89iV40Dn06KMwHwYDVR0jBBgw FoAUWYVKKZg36ryR+h1omrSGo3ic+HowFAYIKwYBBQUHDQMECAQGQ2xpZW50MA0G CSqGSIb3DQEBCwUAA4IBAQA2gVHTFyXOsjs2Vr1/EqNvx//a5QM+xcBSUvTQXfzZ zoNofN0YCR5gc5SfS7ihf5R95MkrYXfKdhgCriqXVYExWiA0uPOLWsuMj9iaDJys 0494kUMA9UqiS+8AIfidCqkn4G1QpqtjEwPQMp3M2U3GkTkabQp6BB0Lf6srai6a ASk33xatdm8c8mf8sTemm3Iu2VDR02eX6gNeDdo4S1pmil1HsIPJKqDEwXvRY0nF kxedriyHdsXAz6Cb3stSl0szAeRuQ/B2UF3nW7VGMAjLiMFuDTLXai0539bzii0A 5rujJu/mt+wyljie0JUBfK1dvDCSSQUbHl4IEFGTX08b -----END CERTIFICATE-----
If you get an error involving certificates change the following line in the code
cert = 'C:\certificates\clientandkey.pem'
by
cert = ('C:/certificates/client.pem', 'C:/certificates/client_key.pem')Option 2: Connecting using Windows authentication
You will need to also install the following module to handle NTLM authentication:
pip install requests_ntlm
Create a python file test.py with the following contents (strings in red should be replaced to match your environment):import requests from requests_ntlm import HttpNtlmAuth requests.packages.urllib3.disable_warnings() #Set up necessary headers comma separated xrf = 'iX83QmNlvu87yyAB' headers = {'X-Qlik-xrfkey': xrf, "Content-Type": "application/json", "User-Agent":"Windows"} #Set up user credentials user_auth = HttpNtlmAuth('domain\\user1','MyPassword') #add xrfkey to URL url = 'https://qlikserver1.domain.local/qrs/app/full?xrfkey={}'.format(xrf) #Call the endpoint to get the list of Qlik Sense apps resp = requests.get(url,headers = headers,verify=False,auth=user_auth) if resp.status_code != 200: # Returns an error if something went wrong. raise ApiError('GET /qrs/app/full {}'.format(resp.status_code)) for app in resp.json(): print('{1} {0}'.format(app['id'], app['name']))
Example of result obtained:PS C:\certificates> python test.py 9b428869-0fba-4ba5-9f94-901ae2fdf041 test1 72e183c7-f838-4a8e-8e16-1014aa80acb4 License Monitor 38476273-ae47-475b-bee0-68cffa384ae1 Operations Monitor 9cdad10c-a230-4c78-b4f7-0d97ca30a48a testuser2 9fa859ed-b59c-4574-bf26-2620e09f1289 test1(1) d3c96fe7-2b3b-457a-82d7-2b32edbf4190 License Monitor_22.0.4.0 df32a902-bccb-4187-8c64-4223f6694f7c Operations Monitor_22.0.4.0
! The information in this article is provided as-is and to be used at own discretion. Ongoing support on the solution is not provided by Qlik Support. -
Upgrading and unbundling the Qlik Sense Repository Database using the Qlik Postg...
In this article, we walk you through the requirements and process of how to upgrade and unbundle an existing Qlik Sense Repository Database (see suppo... Show MoreIn this article, we walk you through the requirements and process of how to upgrade and unbundle an existing Qlik Sense Repository Database (see supported scenarios) as well as how to install a brand new Repository based on PostgreSQL. We will use the Qlik PostgreSQL Installer (QPI).
For a manual method, see How to manually upgrade the bundled Qlik Sense PostgreSQL version to 12.5 version.
Using the Qlik Postgres Installer not only upgrades PostgreSQL; it also unbundles PostgreSQL from your Qlik Sense Enterprise on Windows install. This allows for direct control of your PostgreSQL instance and facilitates maintenance without a dependency on Qlik Sense. Further Database upgrades can then be performed independently and in accordance with your corporate security policy when needed, as long as you remain within the supported PostgreSQL versions. See How To Upgrade Standalone PostgreSQL.
Index
- Supported Scenarios
- Upgrades
- New installs
- Requirements
- Known limitations
- Installing anew Qlik Sense Repository Database using PostgreSQL
- Qlik PostgreSQL Installer - Download Link
- Upgrading an existing Qlik Sense Repository Database
- The Upgrade
- Next Steps and Compatibility with PostgreSQL installers
- How do I upgrade PostgreSQL from here on?
- Troubleshooting and FAQ
- Video Walkthrough
- Related Content
Supported Scenarios
Upgrades
The following versions have been tested and verified to work with QPI (1.4.0):
Qlik Sense February 2022 to Qlik Sense November 2023.
If you are on a Qlik Sense version prior to these, upgrade to at least February 2022 before you begin.
Qlik Sense November 2022 and later do not support 9.6, and a warning will be displayed during the upgrade. From Qlik Sense August 2023 a upgrade with a 9.6 database is blocked.
New installs
The Qlik PostgreSQL Installer supports installing a new standalone PostgreSQL database with the configurations required for connecting to a Qlik Sense server. This allows setting up a new environment or migrating an existing database to a separate host.
Requirements
- Review the QPI Release Notes before you continue
-
Using the Qlik PostgreSQL Installer on a patched Qlik Sense version can lead to unexpected results. If you have a patch installed, either:
- Uninstall all patches before using QPI (see Installing and Uninstalling Qlik Sense Patches) or
- Upgrade to an IR release of Qlik Sense which supports QPI
- The PostgreSQL Installer can only upgrade bundled PostgreSQL database listening on the default port 4432.
- The user who runs the installer must be an administrator.
- The backup destination must have sufficient free disk space to dump the existing database
- The backup destination must not be a network path or virtual storage folder. It is recommended the backup is stored on the main drive.
- There will be downtime during this operation, please plan accordingly
- If upgrading to PostgreSQL 14 and later, the Windows OS must be at least Server 2016
Known limitations
- Cannot migrate a 14.8 embedded database to a standalone
- Using QPI to upgrade a standalone database or a database previously unbundled with QPI is not supported.
- The installer itself does not provide an automatic rollback feature.
Installing a new Qlik Sense Repository Database using PostgreSQL
- Run the Qlik PostgreSQL Installer as an administrator
- Click on Install
- Accept the Qlik Customer Agreement
- Set your Local database settings and click Next. You will use these details to connect other nodes to the same cluster.
- Set your Database superuser password and click Next
- Set the database installation folder, standard: C:\Program Files\PostgreSQL\14
Do not use the standard Qlik Sense folders, such as C:\Program Files\Qlik\Sense\Repository\PostgreSQL\ and C:\Programdata\Qlik\Sense\Repository\PostgreSQL\.
- Set the database data folder, standard: C:\Program Files\PostgreSQL\14\data
Do not use the standard Qlik Sense folders, such as C:\Program Files\Qlik\Sense\Repository\PostgreSQL\ and C:\Programdata\Qlik\Sense\Repository\PostgreSQL\.
- Review your settings and click Install, then click Finish
- Start installing Qlik Sense Enterprise Client Managed. Choose Join Cluster option.
The Qlik PostgreSQL Installer has already seeded the databases for you and has created the users and permissions. No further configuration is needed. - The tool will display information on the actions being performed. Once installation is finished, you can close the installer.
If you are migrating your existing databases to a new host, please remember to reconfigure your nodes to connect to the correct host. How to configure Qlik Sense to use a dedicated PostgreSQL database
Qlik PostgreSQL Installer - Download Link
Download the installer here.Qlik PostgreSQL installer Release Notes
Upgrading an existing Qlik Sense Repository Database
The following versions have been tested and verified to work with QPI (1.4.0):
February 2022 to November 2023.
If you are on any version prior to these, upgrade to at least February 2022 before you begin.
Qlik Sense November 2022 and later do not support 9.6, and a warning will be displayed during the upgrade. From Qlik Sense August 2023 a 9.6 update is blocked.
The Upgrade
- Stop all services on rim nodes
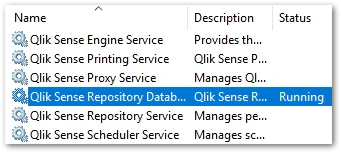
- On your Central Node, stop all services except the Qlik Sense Repository Database
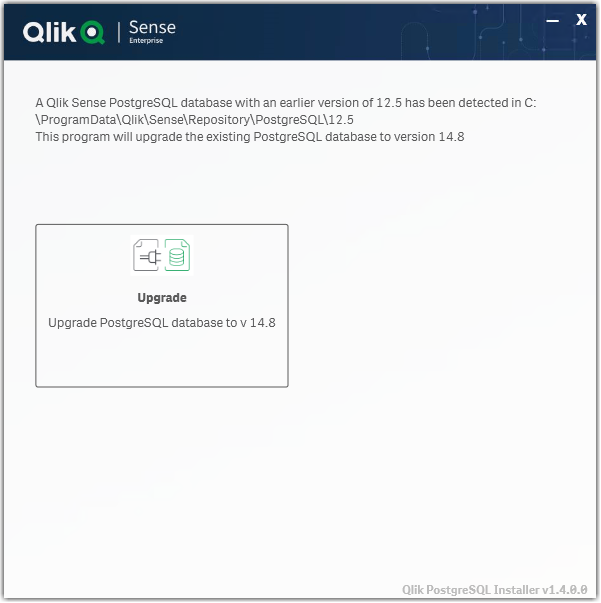
- Run the Qlik PostgreSQL Installer. An existing Database will be detected.
- Highlight the database and click Upgrade
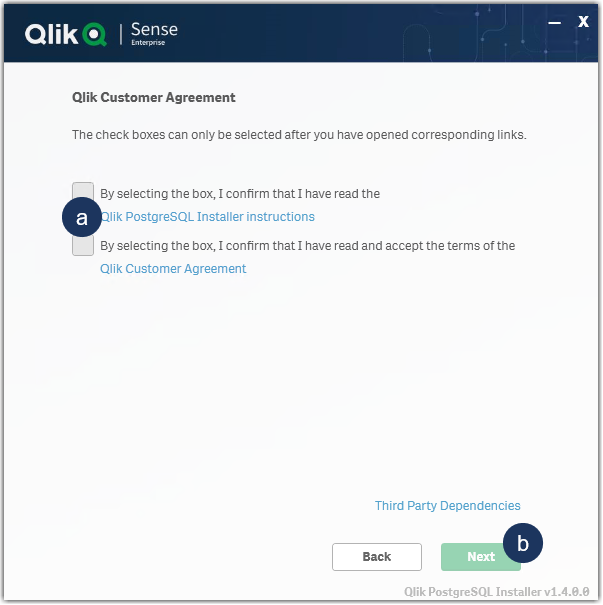
- Read and confirm the (a) Installer Instructions as well as the Qlik Customer Agreement, then click (b) Next.
- Provide your existing Database superuser password and click Next.
- Define your Database backup path and click Next.
- Define your Install Location (default is prefilled) and click Next.
- Define your database data path (default is prefilled) and click Next.
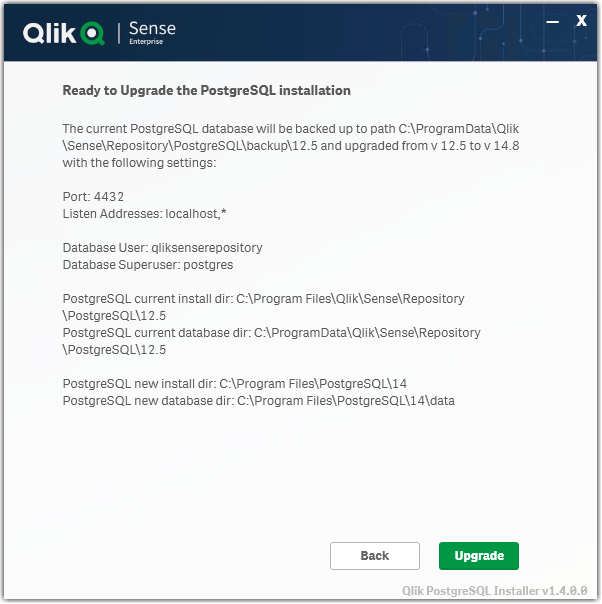
- Review all properties and click Upgrade.
The review screen lists the settings which will be migrated. No manual changes are required post-upgrade. - The upgrade is completed. Click Close.
- Open the Windows Services Console and locate the Qlik Sense Enterprise on Windows services.
You will find that the Qlik Sense Repository Database service has been set to manual. Do not change the startup method.
You will also find a new postgresql-x64-14 service. Do not rename this service.
- Start all services except the Qlik Sense Repository Database service.
- Start all services on your rim nodes.
- Validate that all services and nodes are operating as expected. The original database folder in C:\ProgramData\Qlik\Sense\Repository\PostgreSQL\X.X_deprecated
-
Uninstall the old Qlik Sense Repository Database service.
This step is required. Failing to remove the old service will lead the upgrade or patching issues.
- Open a Windows File Explorer and browse to C:\ProgramData\Package Cache
- From there, search for the appropriate msi file.
If you were running 9.6 before the upgrade, search PostgreSQL.msi
If you were running 12.5 before the upgrade, search PostgreSQL125.msi - The msi will be revealed.
- Right-click the msi file and select uninstall from the menu.
- Open a Windows File Explorer and browse to C:\ProgramData\Package Cache
- Re-install the PostgreSQL binaries. This step is optional if Qlik Sense is immediately upgraded following the use of QPI. The Sense upgrade will install the correct binaries automatically.
Failing to reinstall the binaries will lead to errors when executing any number of service configuration scripts.
If you do not immediately upgrade:
- Open a Windows File Explorer and browse to C:\ProgramData\Package Cache
- From there, search for the .msi file appropriate for your currently installed Qlik Sense version
For Qlik Sense August 2023 and later: PostgreSQL14.msi
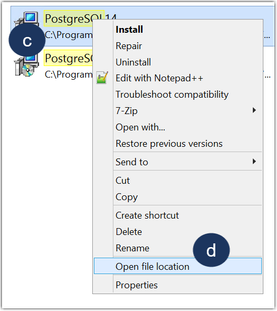
Qlik Sense February 2022 to May 2023: PostgreSQL125.msi - Right-click the file
- Click Open file location
- Highlight the file path, right-click on the path, and click Copy
- Open a Windows Command prompt as administrator
- Navigate to the location of the folder you copied
Example command line:
cd C:\ProgramData\Package Cache\{GUID}
Where GUID is the value of the folder name. - Run the following command depending on the version you have installed:
Qlik Sense August 2023 and later
msiexec.exe /qb /i "PostgreSQL14.msi" SKIPINSTALLDBSERVICE="1" INSTALLDIR="C:\Program Files\Qlik\Sense"
Qlik Sense February 2022 to May 2023
msiexec.exe /qb /i "PostgreSQL125.msi" SKIPINSTALLDBSERVICE="1" INSTALLDIR="C:\Program Files\Qlik\Sense"
This will re-install the binaries without installing a database. If you installed with a custom directory adjust the INSTALLDIR parameter accordingly. E.g. you installed in D:\Qlik\Sense then the parameter would be INSTALLDIR="D:\Qlik\Sense".
- Open a Windows File Explorer and browse to C:\ProgramData\Package Cache
If the upgrade was unsuccessful and you are missing data in the Qlik Management Console or elsewhere, contact Qlik Support.
Next Steps and Compatibility with PostgreSQL installers
Now that your PostgreSQL instance is no longer connected to the Qlik Sense Enterprise on Windows services, all future updates of PostgreSQL are performed independently of Qlik Sense. This allows you to act in accordance with your corporate security policy when needed, as long as you remain within the supported PostgreSQL versions.
Your PostgreSQL database is fully compatible with the official PostgreSQL installers from https://www.enterprisedb.com/downloads/postgres-postgresql-downloads.
How do I upgrade PostgreSQL from here on?
See How To Upgrade Standalone PostgreSQL, which documents the upgrade procedure for either a minor version upgrade (example: 14.5 to 14.8) or a major version upgrade (example: 12 to 14). Further information on PostgreSQL upgrades or updates can be obtained from Postgre directly.
Troubleshooting and FAQ
- If the installation crashes, the server reboots unexpectedly during this process, or there is a power outage, the new database may not be in a serviceable state. Installation/upgrade logs are available in the location of your temporary files, for example:
C:\Users\Username\AppData\Local\Temp\2
A backup of the original database contents is available in your chosen location, or by default in:
C:\ProgramData\Qlik\Sense\Repository\PostgreSQL\backup\X.X
The original database data folder has been renamed to:
C:\ProgramData\Qlik\Sense\Repository\PostgreSQL\X.X_deprecated - Upgrading Qlik Sense after upgrading PostgreSQL with the QPI tool fails with:
This version of Qlik Sense requires a 'SenseServices' database for multi cloud capabilities. Ensure that you have created a 'SenseService' database in your cluster before upgrading. For more information see Installing and configuring PostgreSQL.
See Qlik Sense Upgrade fails with: This version of Qlik Sense requires a _ database for _.
To resolve this, start the postgresql-x64-XX service.
Video Walkthrough
Video chapters:
- 01:00 - What is PostgreSQL used for?
- 01:19 - Different versions of PostgreSQL
- 02:38 - Prerequisites for upgrading
- 03:21 - QS Feb 2022 threshold
- 04:33 - Downloading the QPI Installer
- 06:00 - Upgrade process
- 09:54 - Verifying a successful upgrade
- 12:08 - Removing the old Database Service
- 14:16 - Resolving common issues
- 17:28 - Q&A: When is best time to upgrade?
- 18:05 - Q&A: Does the QPI Tool use the latest version?
- 18:27 - Q&A: Which versions should you be careful with?
- 18:55 - Q&A: What are the Do's and Don'ts?
- 19:44 - Q&A: What should we upgrade first?
- 20:28 - Q&A: How to we avoid having to restart the upgrade?
- 21:22 - Q&A: Can we upgrade the database only?
- 21:47 - Q&A: Is it possible to lose any custom settings?
- 22:31 - Q&A: How to tell which version QS is using?
- 23:35 - Q&A: What is the command to remove the old service?
- 24:12 - Q&A: What if the database is on the D drive?
- 24:50 - Q&A: Can the back-up be on ANY local drive?
- 25:05 - Q&A: Are old version of QS compatible with new PostgreSQL?
The information in this article is provided as-is and to be used at own discretion. Depending on tool(s) used, customization(s), and/or other factors ongoing support on the solution below may not be provided by Qlik Support. The video in this article was recorded in a earlier version of QPI, some screens might differ a little bit.
Related Content
Qlik PostgreSQL installer version 1.3.0 Release Notes
Techspert Talks - Upgrading Qlik Sense Repository Service
Backup and Restore Qlik Sense Enterprise documentation
Migrating Like a Boss
Optimizing Performance for Qlik Sense Enterprise
Qlik Sense Enterprise on Windows: How To Upgrade Standalone PostgreSQL
How-to reset forgotten PostgreSQL password in Qlik Sense
How to configure Qlik Sense to use a dedicated PostgreSQL database
Troubleshooting Qlik Sense Upgrades -
Cannot edit/delete ODAG links when changing app owner
When an On-Demand App Generation (ODAG) link is created in a selection app and the app is transferred to another owner, then the new owner can only se... Show MoreWhen an On-Demand App Generation (ODAG) link is created in a selection app and the app is transferred to another owner, then the new owner can only see the option "Add to App Navigation" in the right-click context menu. Options "Edit" and "Delete" are missing.
The same issue happens when the selection app is duplicated by another user.Resolution:
This is a known limitation of Qlik Sense and has been reported in defectQLIK-83203.There are default security rules: CreateOdagLinks and ReadOdagLinks.
But no default rule for Update/ Delete of ODAG links.
A work-around solution at the moment is to create custom security rules that grants Update/ Delete access of ODAG links to the new app owner, similar to the followings:
ODAG links are meant to be managed similar to Data connections, where a connection created in one app can be used in other apps. However, while the QMC provides a Data connections tab to list down all connections and control related ownership/ permissions, such management GUI is not available for ODAG links. R&D is considering the ODAG link management page in future releases of the product. -
Error - [SQL Server]Invalid parameter passed to OpenRowset(DBLog, ...)
When running a Replicate CDC task replicating from MS-SQL source endpoint, you may get an error like the following error: [SOURCE_CAPTURE ]E: SqlStat... Show MoreWhen running a Replicate CDC task replicating from MS-SQL source endpoint, you may get an error like the following error:
[SOURCE_CAPTURE ]E: SqlStat: 42000 NativeError:9005 [Microsoft][ODBC Driver 17 for SQL Server][SQL Server]Invalid parameter passed to OpenRowset(DBLog, ...). (PcbMsg: 105) [1020417] (sqlserver_log_processor.c:4310)
Environment
- Qlik Replicate with CDC task running on MS-SQL source endpoint
Resolution
1. If the cause of the problem is reason 1 mentioned below, to eliminate the error, you should edit the MS-SQL source endpoint setting under Replicate GUI:
manage endpoints connections --> [your MS-SQL source endpoint definition] --> advanced tab --> internal parameters
add the internal parameter : ignoreTxnCtxValidityCheck and set it to True
2. If the cause of the problem is reason 2 mentioned below, you should make sure that the TLOG backups are available to Replicate
Possible Causes
1. When working with MS-SQL source endpoint, COMMIT event usually show up with LCX_NULL context. Here it comes with a context which is not recognized yet and therefore Replicate produces an error. An easy and immediate option to solve the error is to ignore the validity of the CONTEXT value in case of COMMIT, assuming that MS-SQL storage engine knows its job better than Replicate.
2. When Replicate reads from the online log it will use the fn_dblog function, the first parameter passed to the query is the last LSN that Replicate processed. If There is no access to the backups and the log has been truncated you can get this error
(If probelm persists need to produce detailed debug information for further analysis)
-
SQL Server Source: Qlik Replicate encountered third-party backup files during p...
This applies when using SQL Server as a source endpoint. WARNING: [SOURCE_CAPTURE ]W: Replicate encountered third-party backup files during prelimina... Show More -
Qlikview DSC did not respond to request. The remote server returned an unexpecte...
When trying to access the license Setup in the QMC http://localhost:4780/qmc/Licenses.htm# the system returns the following error: localhost:4780 sa... Show MoreWhen trying to access the license Setup in the QMC http://localhost:4780/qmc/Licenses.htm# the system returns the following error:
localhost:4780 says

Dsc did not respond to request.
Last exception (for http://localhost:4730/DSC/Service):
The remote server returned an unexpected response:
(413) Request Entity Too Large.
You will also see the following errors when navigating to the license section http://localhost:4780/QMC/Licenses.htm#
localhost:4780 says
Not found: EntLicenses.Properties.NxLicenselnfo.AllowLicenseLease
localhost:4780 says
Not found:
Entlicenses.Properties.NxLicenselnfo.AllowDynamicAssignmentProfessionalEnvironment
- Qlikview version 12.40 and above
Resolution
- Stop the QlikviewDirectoryServiceConnector service
- Modify C:\Program Files\QlikView\Directory Service Connector\QVDirectoryServiceConnector.exe.config and add <add key="MaxReceivedMessageSize" value="26214400" /> under the appsettings section.
- Start the QlikviewDirectoryServiceConnector service
Cause
The response message size (Content-Length) exceeded 262144 characters in the DSC SOAP request.
-
Qlik Cloud Analytics: Visualization Bundle extensions uploaded to the tenant do ...
Visualisation Bundle extensions that have been uploaded from a client-managed version of Qlik Sense are not updated automatically. The expected new ... Show MoreVisualisation Bundle extensions that have been uploaded from a client-managed version of Qlik Sense are not updated automatically.
The expected new features are missing, and, when checking the extensions in the Management Console/Administration section, they have an old date.Resolution
Remove the manually-uploaded Visualisation Bundle extensions from the Management Console/Administration page, to use the ones that come with Qlik Cloud Analytics. Only the integrated extensions get updated automatically.
Cause
Visualisation Bundle extensions that have been manually uploaded to the tenant overwrite the ones integrated within the platform. The uploaded extensions won't be automatically updated.
Environment
-
How to view cases in Support Portal
This article explains how to view your own and your colleague's cases in the Support Case Portal. Steps: Login to the Qlik Community Click on Support... Show MoreThis article explains how to view your own and your colleague's cases in the Support Case Portal.
Steps:
- Login to the Qlik Community
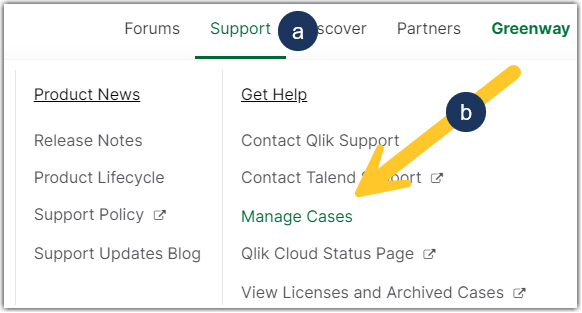
- Click on Support in the top navigational ribbon
- Click Manage Cases (or use the direct link: Case Portal)
- You will then have access to your cases.
- From there, choose between OPEN and RESOLVED cases. The default view is your cases only.
Cases with "Solution Proposed" status are listed in the "RESOLVED" tab. - Click 3 dots, then choose 'My Organization's Cases' to view your colleague's cases
If you do not have this option, see How To View Other User Cases Within Your Organization.
Related Content:
How to create a case and contact Qlik Support
-
Configure Qlik Sense Mobile for iOS and Android
The Qlik Sense Mobile app allows you to securely connect to your Qlik Sense Enterprise deployment from your supported mobile device. This is the proce... Show MoreThe Qlik Sense Mobile app allows you to securely connect to your Qlik Sense Enterprise deployment from your supported mobile device. This is the process of configuring Qlik Sense to function with the mobile app on iPad / iPhone.
This article applies to the Qlik Sense Mobile app used with Qlik Sense Enterprise on Windows. For information regarding the Qlik Cloud Mobile app, see Setting up Qlik Sense Mobile SaaS.
Content:
- Pre-requirements (Client-side)
- Configuration (Server-side)
- Update the Host White List in the proxy
- Configuration (Client side)
Pre-requirements (Client-side)
See the requirements for your mobile app version on the official Qlik Online Help > Planning your Qlik Sense Enterprise deployment > System requirements for Qlik Sense Enterprise > Qlik Sense Mobile app
Configuration (Server-side)
Acquire a signed and trusted Certificate.
Out of the box, Qlik Sense is installed with HTTPS enabled on the hub and HTTP disabled. Due to iOS specific certificate requirements, a signed and trusted certificate is required when connecting from an iOS device. If using HTTPS, make sure to use a certificate issued by an Apple-approved Certification Authority.
Also check Qlik Sense Mobile on iOS: cannot open apps on the HUB for issues related to Qlik Sense Mobile on iOS and certificates.
For testing purposes, it is possible to enable port 80.(Optional) Enable HTTP (port 80).
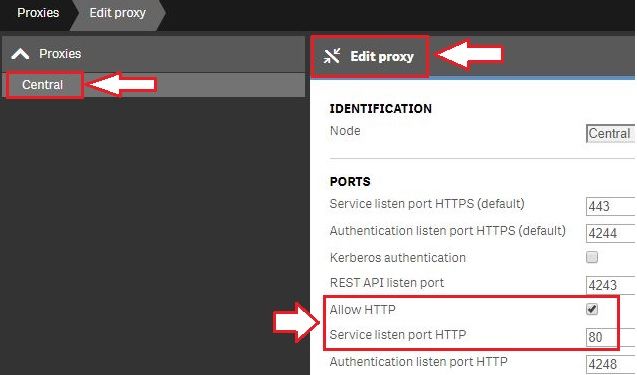
- Open the Qlik Sense Management Console and navigate to Proxies.
- Select the Proxy you wish to use and click Edit Proxy.
- Check Allow HTTP
Update the Host White List in the proxy
If not already done, add an address to the White List:
- In Qlik Management Console, go to CONFIGURE SYSTEM -> Virtual Proxies
- Select the proxy and click Edit
- Select Advanced in Properties list on the right pane
- Scroll to Advanced section in the middle pane
- Locate "Allow list"
- Click "Add new value" and add the addresses being used when connecting to the Qlik Sense Hub from a client. See How to configure the WebSocket origin allow list and best practices for details.
Generate the authentication link:
An authentication link is required for the Qlik Sense Mobile App.
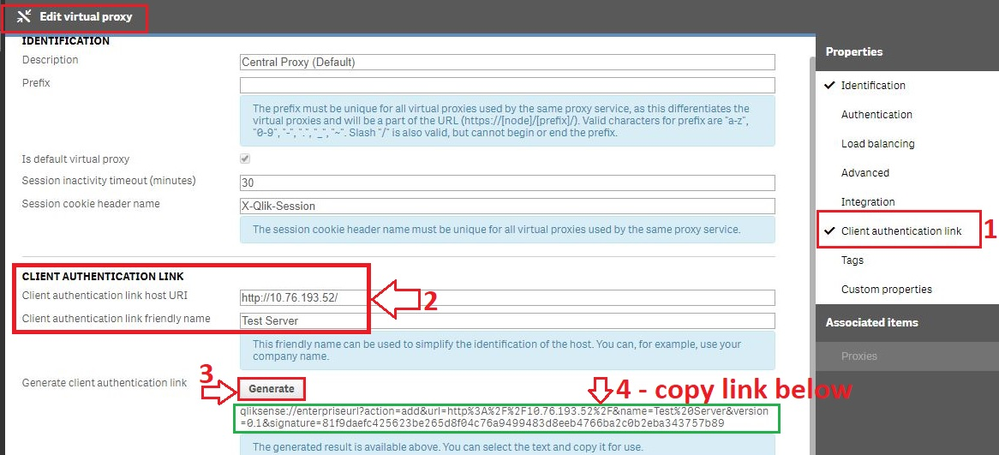
- Navigate to Virtual Proxies in the Qlik Sense Management Console and edit the proxy used for mobile App access
- Enable the Client authentication link menu in the far right menu.
- Generate the link.
NOTE: In the client authentication link host URI, you may need to remove the "/" from the end of the URL, such as http://10.76.193.52/ would be http://10.76.193.52
Associate User access pass
Users connecting to Qlik Sense Enterprise need a valid license available. See the Qlik Sense Online Help for more information on how to assign available access types.
Qlik Sense Enterprise on Windows > Administer Qlik Sense Enterprise on Windows > Managing a Qlik Sense Enterprise on Windows site > Managing QMC resource > Managing licenses- Managing professional access
- Managing analyzer access
- Managing user access
- Creating login access rules
Configuration (Client side)
- Install Qlik Sense mobile app from AppStore.
- Provide authentication link generated in QMC
- Open the link from your device (this can be also done by going to the Hub, clicking on the menu icon at the top right and selecting "Client Authentication"), the installed application will be triggered automatically, and the configuration parameters will be applied.
- Enter user credentials for QS server
-
Qlik Talend Administration Center: How to resolve RepoProjectRefresher - Error G...
The following error message appears repeatedly in the logs. 2024-01-20 08:50:10 ERROR RepoProjectRefresher -2024-01-10 16:58:47 ERROR GC - D:\Talend\7... Show MoreThe following error message appears repeatedly in the logs.
2024-01-20 08:50:10 ERROR RepoProjectRefresher -
2024-01-10 16:58:47 ERROR GC - D:\Talend\7.3.1\tac\apache-tomcat\temp\_git\Cause
The main reason for the log type is that the RepoProjectRefresher faces out of memory issues. By default, TAC automatically caches/checks out the project source code into the tac\apache-tomcat\temp folder. When the source code accumulation is large, the RepoProjectRefresher module will consume a lot of memory. When maximum value is reached, a GC error will occur and a GC error log will be generated.
Note: The RepoRefresher cache functionality has been deprecated in the latest version of TAC v8.0.1
Resolution
Disable the Git caching mechanism for the TAC project by following these steps:
- Update whitelist setting for TAC DB t731 using query.
update t731.configuration set value='true' where configuration.key='git.whiteListBranches.enable'; update t731.configuration set value='\"Technical labels of project\",\"Active branch name\"' where configuration.key='git.whiteListBranches.list'; - Delete the previous Git whitelist cached setting file: talend\tomcat\webapps\tac\WEB-INF\classes\active_git_branches.csv
- Restart TAC.
Environment
- Update whitelist setting for TAC DB t731 using query.
-
Assigned Users under the Assigned CALs tab in the QlikView Management Console is...
QlikView Administrators cannot see the list of Assigned Users under the Assigned CALs tab in the QlikView Management Console although they can see lic... Show MoreQlikView Administrators cannot see the list of Assigned Users under the Assigned CALs tab in the QlikView Management Console although they can see licenses are assigned under the General tab.
It is important to note that the QlikView users are not experiencing any issues accessing applications. This only affects the QlikView Administrator who wants to see details of which users have had CALs assigned to them.
Environment:
The QlikView Management Service is calling the QlikView Service for the Assigned CALs information. If there are a large number of Assigned CALs, the information is not received by the QMS in time and the information is not presented on the screen. By increasing the MaxReceivedMessageSize we are allowing the QMC more time to receive the information from the QMS.
This will affect customers with a large number of Assigned CALs.
Resolution:
- Log onto the QlikView Management Server
- Open a Windows Explorer Window and browse to C:\Program Files\QlikView\Management Service
- Open the file QVManagementService.exe.config
- Change <add key="MaxReceivedMessageSize" value="262144"/> to <add key="MaxReceivedMessageSize" value="2621440"/>
- Restart the QlikView Management Service
-
Qlik Cloud: Call Qlik APIs using JWT authentication (PowerShell)
This is a sample of how to call the Qlik Cloud APIs to assign an Analyzer license to a user with PowerShell/JWT authentication. Environment Qlik Cl... Show MoreThis is a sample of how to call the Qlik Cloud APIs to assign an Analyzer license to a user with PowerShell/JWT authentication.
Environment
Resolution
In order to call Qlik Cloud API with JWT authentication, the first step is to call POST /login/jwt-session to get the necessary cookies. Which API can be called depends on the privileges the JWT user has been assigned.
[Net.ServicePointManager]::SecurityProtocol = [Net.SecurityProtocolType]::Tls12 $hdrs = @{} # Put your JWT token here $hdrs.Add("Authorization","Bearer eyJhbGciOiJSU...pgacN8QqAjKug") $url = "https://tenant.ap.qlikcloud.com/login/jwt-session" $resp = Invoke-WebRequest -Uri $url -Method Post -ContentType 'application/json' -Headers $hdrs #Fetch all required cookies $AWSALB= [Regex]::Matches($resp.RawContent, "(?<=AWSALB\=).+?(?=; Expires)") $AWSALBCORS= [Regex]::Matches($resp.RawContent, "(?<=AWSALBCORS\=).+?(?=; Expires)") $eassid= [Regex]::Matches($resp.RawContent, "(?<=eas.sid\=).+?(?=; path)") $eassidsig= [Regex]::Matches($resp.RawContent, "(?<=eas.sid.sig\=).+?(?=; path)") $csrftoken= [Regex]::Matches($resp.RawContent, "(?<=_csrfToken\=).+?(?=; path)") $csrftokensig= [Regex]::Matches($resp.RawContent, "(?<=_csrfToken.sig\=).+?(?=; path)") $allCookies = "AWSALB="+$AWSALB.Value+";AWSALBCORS="+$AWSALBCORS.Value+";eas.sid="+$eassid.Value+";eas.sid.sig="+$eassidsig.Value+";_csrfToken="+$csrftoken.Value+";_csrfToken.sig="+$csrftokensig.Value $session = New-Object Microsoft.PowerShell.Commands.WebRequestSession foreach ($cookiePair in $allCookies.Split((";"))) { $cookieValues = $cookiePair.Trim().Split("=") $cookie = New-Object System.Net.Cookie $cookie.Name = $cookieValues[0] $cookie.Value = $cookieValues[1] $cookie.Domain = "tenant.ap.qlikcloud.com" $session.Cookies.Add($cookie); } $hdrs = @{} #Request that modify content such as POST/PATCH requests need the Qlik-Csrf-Token header $hdrs.Add("Qlik-Csrf-Token",$csrftoken.value) $body = '{"add":[{"subject":"DOMAIN\\user1","type":"analyzer"}]}' $url = "https://tenant.ap.qlikcloud.com/api/v1/licenses/assignments/actions/add" Invoke-RestMethod -Uri $url -Method Post -Headers $hdrs -Body $body -WebSession $session -
Qlik Cloud SMTP Configuration Error: "Email Provider is not working as expected"
If a tenant previously had an incomplete SMTP configuration with their Qlik Cloud, an error message will now be shown to the Tenant Administrator: Yo... Show MoreIf a tenant previously had an incomplete SMTP configuration with their Qlik Cloud, an error message will now be shown to the Tenant Administrator:
- Your email providers is not working – Go to Settings
Resolution
To resolve this error a Tenant Admin can enter valid SMTP credentials.
At the moment, it is not possible to delete/clear the previous credential entry in the authentication. An option to clear the credentials is being prepared to support a return to a default (non-configured/empty) state and is expected to be available in the coming weeks.We will update this article when the ability to clear becomes available.
Example SMTP Error
Cause
With the release of the SMTP service connectivity for Microsoft O365 from the Management Console, more stringent error checking was added to the basic authentication configuration.
Related Content
If interested, Admins can still successfully connect to Microsoft 0365 SMTP with this error showing. More details on the new available 0Auth2 authentication can be found here: Qlik Cloud: Introducing OAuth2 authentication for ... - Qlik Community - 2444243
Internal Investigation ID
- QB-26792
Environment
- Qlik Cloud
-
Qlik Replicate upgrade on a Windows Cluster from 2022.5 or .11 to 2023.5 and 202...
This article provides the steps needed to successfully upgrade Qlik Replicate installed on a Windows Cluster. Environment: Qlik Replicate 2022.5 upgr... Show MoreThis article provides the steps needed to successfully upgrade Qlik Replicate installed on a Windows Cluster.
Environment:
- Qlik Replicate 2022.5 upgrade to 2023.5
- Qlik Replicate 2022.11 upgrade to 2023.11
Resolution
- Stop all tasks. Note that some tasks could take up to 20 minutes or more to stop. Monitor the process before you continue.
- Assuming we are on Active Node A: from the Cluster Manager, take the Qlik Replicate Server and Qlik Replicate UI server Offline. Note: the services may still be referred to as Attunity Replicate.
- Take a backup of all your task definitions on Node A: Replicate Command Line Console as Administrator
- Run:
repctl -d "YOUR_DATA_DIRECTORY_PATH" exportrepository
Example: ~Program Files\Attunity\Replicate\bin> repctl -d "S:\Programs\Qlik\Replicate\data" exportrepository
This example writes the backup to the Replication_Definition.json file.
- Back up your data directory by copying it to a folder location outside the Replicate directories. You can skip copying the \logs subfolder.
- On Node A: verify the installed version of Replicate. This can be done by reviewing the program installed through the Windows Add/Remove programs feature. Note: attempting to “upgrade” with an identical version will lead to Replicate being uninstalled.
- Verify what account the Attunity (or Qlik) Windows Services are run with. Note the account credentials (username and password). After the upgrade, the account may have been switched back to Local System and the account credentials will need to be entered again.
- On the active node: perform the upgrade by running a newer version of the Qlik Replicate executable.
- Right-click on the executable and run as administrator.
- Follow the on-screen instructions.
- On Node A:
- Verify that the Qlik Replicate Server and Qlik Replicate UI Server are stopped in the Cluster Manager
- Verify that the Qlik Replicate Server and Qlik Replicate UI Server are stopped in the Windows Services
- Move the Cluster service (this is the role that manages your share drive/Qlik service/and client access point) to another node (Node B in our example). This is going to move the shared drive and service to the other node (Node B).
- On Node B: run the same upgrade as previously done on Node A, repeating steps 8 to 9.
- Repeat the upgrade steps on any additional nodes.
- Once all Nodes are upgraded from Windows Cluster Manager, verify that Qlik Replicate is referred to as Qlik Replicate Server and Qlik Replicate UI server. If the services are named Attunity, then remove the service and add the Qlik Services to your Windows Cluster Roles and define all dependencies. See Add the Qlik Replicate services or details.
- Verify the account running the Qlik Services on all nodes, changing the account back to the account which was used before the upgrade (see step 7).
- From the Windows Cluster, bring the Qlik Replicate Server and Qlik Replicate UI Server back online.
- Resume the tasks. Note: resume tasks at a rate of five (maximum) at a time until all have been launched.
-
Qlik Replicate upgrade on a Windows Cluster from 2021.5 to 2021.11 and 2022.5
This article provides the steps needed to successfully upgrade Qlik Replicate installed on a Windows Cluster. Environment: Qlik Replicate 2021.5 upgr... Show MoreThis article provides the steps needed to successfully upgrade Qlik Replicate installed on a Windows Cluster.
Environment:
- Qlik Replicate 2021.5 upgrade to 2021.11
- Qlik Replicate upgrade 2021.11 to 2022.5 or 2022.11
Resolution
- Stop all tasks. Note that some tasks could take up to 20 minutes or more to stop. Monitor the process before you continue.
- Assuming we are on Active Node A: from the Cluster Manager, take the Attunity Replicate Server and Attunity Replicate UI server Offline
- Take a backup of all your task definitions on Node A:Qlik Replicate Command Line Console as Administrator
- Run:
repctl -d "YOUR_DATA_DIRECTORY_PATH" exportrepository
Example: ~Program Files\Attunity\Replicate\bin> repctl -d "S:\Programs\Qlik\Replicate\data" exportrepository
This example writes the backup to the Replication_Definition.json file.
- Back up your data directory by copying it to a folder location outside the Qlik Replicate directories. You can skip copying the \logs subfolder.
- On Node A: verify the installed version of Attunity Replicate. This can be done by reviewing the program installed through the Windows Add/Remove programs feature. Note: attempting to “upgrade” with an identical version will lead to Attunity Replicate being uninstalled.
- Verify what account the Attunity (or Qlik) Windows Services are run with. Note the account credentials (username and password). After the upgrade, the account may have been switched back to Local System and the account credentials will need to be entered again.
- On the active node: perform the upgrade by running a newer version of the Qlik Replicate executable.
- Right-click on the executable and run as administrator.
- Follow the on-screen instructions.
- On Node A:
- Verify that the Qlik Replicate Server and Qlik Replicate UI Server are stopped in the Cluster Manager
- Verify that the Qlik Replicate Server and Qlik Replicate UI Server are stopped in the Windows Services
- Move the Cluster service (this is the role that manages your share drive/Qlik service/and client access point) to another node (Node B in our example). This is going to move the shared drive and service to the other node (Node B).
- On Node B: run the same upgrade as previously done on Node A, repeating steps 8 to 9.
- Repeat the upgrade steps on any additional nodes.
- Verify the account running the Attunity Replicate Services on all nodes, changing the account back to the account which was used before the upgrade (see step 7).
- From the Windows Cluster, bring the Attunity Replicate Server and Attunity Replicate UI Server back online.
- Resume the tasks. Note: resume tasks at a rate of five (maximum) at a time until all have been launched.


