Unlock a world of possibilities! Login now and discover the exclusive benefits awaiting you.
Recent Documents
-
Aggr() and set analysis: set modifiers inside and / or outside aggr()?!?
Hi community,"Where should the set modifier be placed? Inside and/or outside the aggr()?"The standard answer is mostly:"If you are unsure, you should ... Show MoreHi community,
"Where should the set modifier be placed? Inside and/or outside the aggr()?"
The standard answer is mostly:
"If you are unsure, you should place the set modifiers inside and outside the aggr(). This will probably lead to the desired result..."
I just can't agree. In my opinion it really, really! depends...


Example 1
sum(aggr(sum(F4),F1))
--> default case
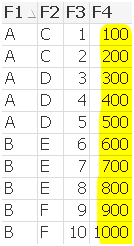
sum(aggr(sum({<F2={"D","E"}>} F4),F1))
--> set modifier at inner aggregation limits F4 values
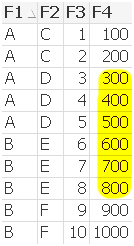
sum({<F2={"D","E"}>} Rangesum(F3,aggr(sum(F4),F1)))
--> set modifier at outer aggregation
--> no difference , because F1={A} exists for F2={D} and F1={B} exists for D2={E}
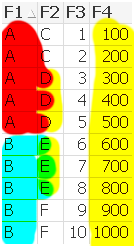
sum({<F2={"D"}>} aggr(sum(F4),F1))
--> set modifier at outer aggregation
--> F1={A} exists for F2={D} and F1={B} doesn‘t exist for D2={E}
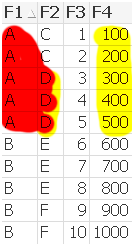
sum({<F2={"D"}>} aggr(sum({<F2={"D"}>}F4),F1))
--> set modifier at inner and outer aggregation
--> F1={A} exists for F2={D} and F1={B} doesn‘t exist for D2={E}
--> set modifier at inner aggregation limits F4 values

Example 2
sum(Rangesum(F3,aggr(sum(F4),F1)))
--> default case
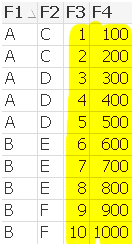
sum(Rangesum(F3,aggr(sum({<F2={"D","E"}>} F4),F1)))
--> set modifier at inner aggregation limits F4 values inside aggr()
--> but doesn’t limit F3 outside aggr()
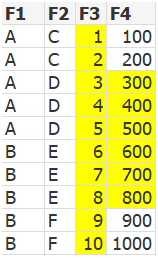
sum({<F2={"D","E"}>} Rangesum(F3,aggr(sum(F4),F1)))
--> set modifier at outer aggregation limits only F3 field, because F1={A} exists for F2={D} and F1={B} exists for D2={E}
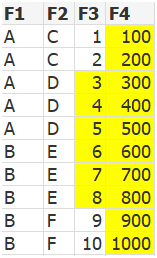
sum({<F2={"D"}>} Rangesum(F3,aggr(sum(F4),F1)))
--> set modifier at outer aggregation
--> limits F3 and F4, because F1={A} exists for F2={D} and F1={B} doesn‘t exist for D2={E}

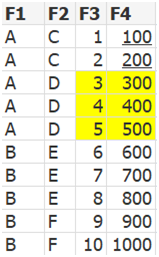
sum({<F2={"D"}>} Rangesum(F3,aggr(sum({<F2={"D"}>} F4),F1)))
--> set modifier at inner and outer aggregation limts F3 and F4 values
Regards
Robin
-
Loading Multiple Excel Sheets Dynamically along with file name and sheet name
Hi All,This document helps you in loading multiple excels and excel sheets with the name of the sheet and data.//to read each file from the specified ... Show MoreHi All,
This document helps you in loading multiple excels and excel sheets with the name of the sheet and data.
//to read each file from the specified folder
FOR EACH file in FileList('filepath\*.xlsx');
//In order to get the file information from SQLtables command making use of the ODBC connection format
ODBC CONNECT32 TO [Excel Files;DBQ=$(file)];
tables:
SQLtables;
DISCONNECT;
FOR i = 0 to NoOfRows('tables')-1
LET sheetName = purgeChar(purgeChar(peek('TABLE_NAME', i, 'tables'), chr(39)), chr(36));
Table:
Load * ,
FileBaseName()as FIle,
FileDir() as Dir,
FileName() as File_Name,
'$(sheetName)' as Sheet_name
From $(file)(ooxml, embedded labels, table is [$(sheetName)]);
NEXT i
NextHope this helps !!!
please find the attachment for the eg: qvw and test fiels
Regards,
-
Month Freeze Document
Hi Folks, If any one interest to freeze all the data by month wise from sql and append it in the qvd to verify the changes per each month. It will hel... Show MoreHi Folks,
If any one interest to freeze all the data by month wise from sql and append it in the qvd to verify the changes per each month. It will help it.
Let vQVDPath = 'D:\';
Let vFreezeTableName = 'MONTH_FREEZE';
LET vNow = Now();
//GFIR
$(vFreezeTableName):
LOAD *,
'$(vNow)' AS MonthFreezeTime,
Floor(Today()) AS MonthFreezeDate,
Floor(MonthEnd(Today(), -1)) AS MonthFreezeDataUptoDate;
SQL Select * from tablename;
//Check the qvd is exists or not
LET vListQVDExists = not isnull(QVDCreateTime('$(vQVDPath)\$(vFreezeTableName).qvd'));
//If exists , concatenate with existing qvds
If($(vListQVDExists)) then
//Find the maximum date
MaxFreezeDate:
LOAD Max(MonthFreezeDate) AS MaxFreezeDateNum Resident $(vFreezeTableName);
//Get the maximum date_num
Let vMaxFreezeNum = Num(Peek('MaxFreezeDateNum',-1, 'MaxFreezeDate'));
//Drop the temporary table
DROP Table MaxFreezeDate;
Concatenate($(vFreezeTableName))
LOAD * From
$(vQVDPath)\$(vFreezeTableName).qvd(qvd)
Where MonthFreezeDate < $(vMaxFreezeNum);
ENDIF;
//Store freeze data into qvd
STORE $(vFreezeTableName) into $(vQVDPath)\$(vFreezeTableName).qvd(qvd);
//Drop the temporary table
DROP Table $(vFreezeTableName);
//Exit script
EXIT Script;
-
Connectivity to Oracle Database
Useful connectivity documentation from QlikView to Oracle Databases -
Functions Cheatsheet.pdf
Hello Everyone,I have attached the document for the important Qlikview functions used in script as well as in UI.Please have a look and also feel free... Show MoreHello Everyone,
I have attached the document for the important Qlikview functions used in script as well as in UI.
Please have a look and also feel free to update the document or comment in the session for the functions which is missed.
-
Instructions on how to enable Audit Logging in the QMC
By default Audit Logging is not Enabled – and a QlikView Administrator cannot simply select or deselect the option. So how do you turn Audit Logging... Show MoreBy default Audit Logging is not Enabled – and a QlikView Administrator cannot simply select or deselect the option. So how do you turn Audit Logging on?
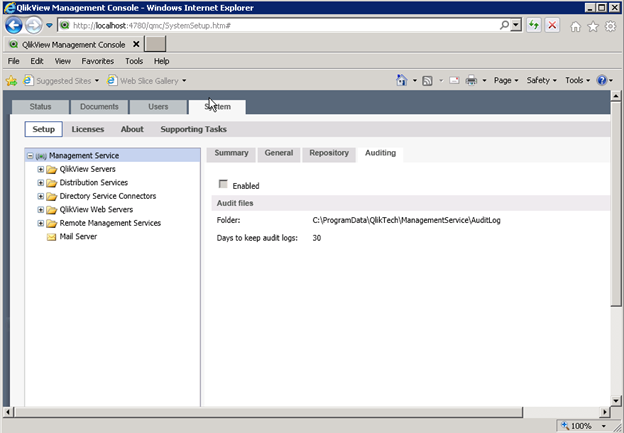
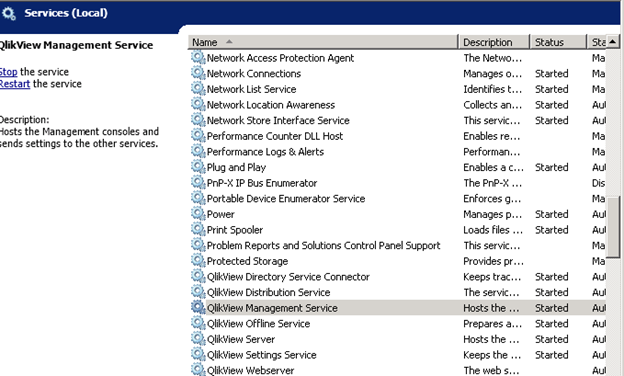
First, you need to stop the QlikView Management Service!
Then edit the QVManagementService.exe.config file using Notepad (you may need to run as an Administrator).

Search for Audit and then change the EnabledAuditLogging from “false” to “true”.
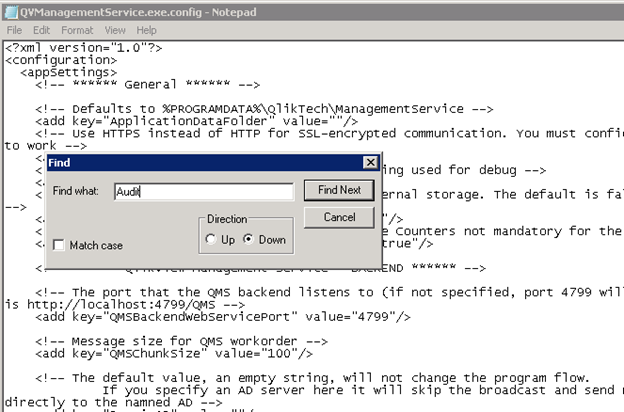
Change the value to True and save the file. Then turn the service back on and check to see if the box is enabled!

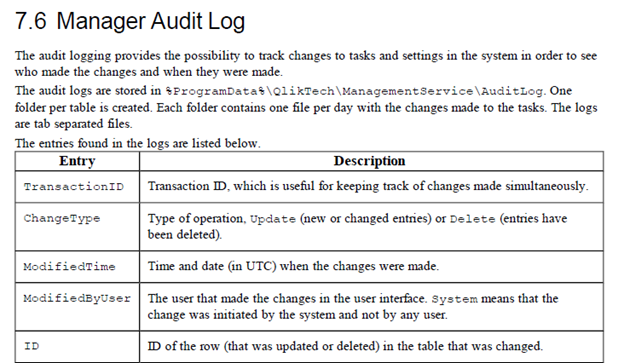
Here is a description of the data collected. The System Monitor 4.1 QlikView application can be used to investigate this dataset.
-
dropdown menu extension
When you are using many tab sheets within QlikView your application can easily become unclear and very full. Using standard tab sheets it is not possi... Show MoreWhen you are using many tab sheets within QlikView your application can easily become unclear and very full. Using standard tab sheets it is not possible to build a hierarchy in your menu.
I have built a dropdown menu extension that allows you to build a hierarchy within your menu and manage multiple tab sheets in a structured way. The menu is easy to install and use, you can configure it from within your QlikView application.
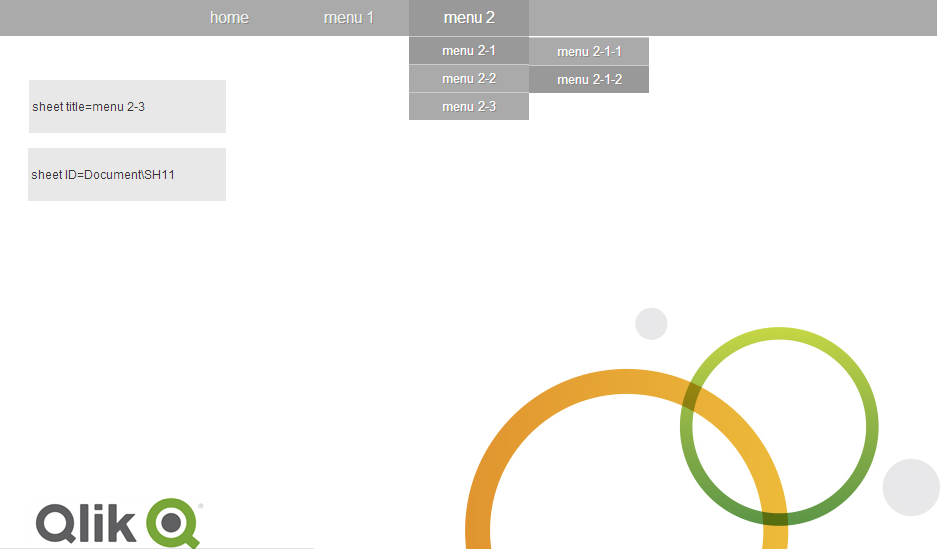
You can find documentation, a sample qvw file and the extension itself at the following location:
petra-bloem/dropdownMenu · GitHub
-
My simple Dynamic Report Builder - use with any data source
This is old news but I just realized I never gave the example someone asked for a year ago.Load any data source(s) with unlimited tables unlimited fie... Show MoreThis is old news but I just realized I never gave the example someone asked for a year ago.
Load any data source(s) with unlimited tables unlimited fields.
My example uses the attached data source to load some Olympic data.
- Load data from any number of sources
- Pick one or more columns from the column picker in the app
The columns will show in the app.
The simplistic beauty is that you do not hard code the name of any fields in your chart you simply have the dimensions as ='$(vDim1)', '$(vDim2)' and so on.
Variables are setup in the load script.
My example is set to allow 21 fields to be added to the dynamic straight table. This means you could have 1,000 fields but the first 21 you select will be added to the chart.
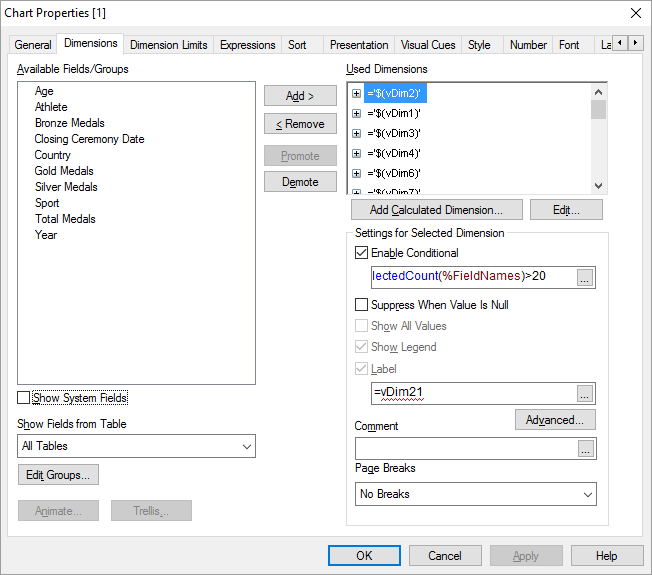
Try it with my data or yours.
-
How to manage your NPrinting task execution from QlikView script
Recently I have heard this question several times, therefore it might be worth of writting something about it.Since version 17.2, NPrinting has empowe... Show MoreRecently I have heard this question several times, therefore it might be worth of writting something about it.
Since version 17.2, NPrinting has empowered its features to external programs by its RESTful APIs. User may easily control and get data from the system with the APIs now. It is a very popular scenario that user wants to start the NPrinting Publish task right after the data reload is done in the QlikView application, so that the published report will have the latest data.
There are several possible ways to it. In this example you will find how to trigger and monitor the NPrinting task through QlikView load script, which requires nothing more than a QlikView Desktop and a Qlik REST connector, besides of the NPrinting environment. In the end of this article you will also see how to chain it with a QlikView document reload task in the QMC, so that the NPrinting task will automatically start right after the QlikView reload task is finished.
Some prerequisites for using this example:
- Qlik NPrinting June 2017 and later
- Qlik REST Connector 1.3
- A publish task has been configured correctly with successful report generation in NPrinting (help)
- A user has been configured correctly in NPrinting with proper security priviliges, and linked to a Windows Domain user (help)
- In order to allow HTTP POST access from QlikView server to NPrinting server, QlikView server’s hostname has been added to the NPrinting Trusted Origins (help)
And this article might be helpful with more information regarding to using NPrinting APIs.
The attached QlikView application in this example is quite self-explanatory. Here I will just list some key components for your attention.
- Authentication: First I create a POST request for NTLM authentication (POST /login/ntlm). This is because the later request for triggering the task is a POST request. And Qlik REST connector cannot mix between a GET connection with a POST connection once the connection string is created.
- Cookie: NPrinting uses Cookies for handling the Web security. You can find the Cookie information from the HTTP response of the authentication request (/login/ntlm). However you need to manually parse the useful part from the raw response, and apply it as the Cookie in the consequent requests. The example QlikView script showed this process.
- WITH CONNECTION: I use WITH CONNECTION syntax from REST connector to reuse a POST or GET connection.
- Looping: For polling the task execution status, I use a loop using "Do ... Loop". Pay attention that you want to drop both the master table and data table within one iteration, so the next iteration can get refreshed data value. I use "IF... THEN" to break the loop because I want to keep the last data table so that the user can have some information about the execution left in the data model. I also use a counter to control the loop because I don't want to wait forever during the debug.
The screenshots below show an example of creating a POST connection for authentication in Qlik REST connector.
Download the attached QlikView document and reload it from your QlikView server machine to test how it works.
At last, you may want to create a reload task in QlikView QMC and chain it to the reload task of your data application, so that the NPrinting publish task will be triggered automatically after the QlikView data reload task is completed successfully. You can find the settings from the screenshot below, or get help from this community article.
Thanks for your reading!
-
QlikView: A Simple Installation Guide
This is a companion article to the available Installation Manual on Qlik Help. The referenced document is written with QlikView November 2018 in mind,... Show MoreThis is a companion article to the available Installation Manual on Qlik Help.
The referenced document is written with QlikView November 2018 in mind, backwards compatible with 12.10, 12.00, and the older 11.20 version.
Please note this document is not meant as a replacement for training and using expert services for implementation. It will not go into great detail with regards to tabs, settings, etc. This information is covered in the documentation and help files. -
Passing Selections and Document Chaining
Document ChainingWhat do you do when your model is so big to the point that isn’t usable and you can’t increase resources to your environment? I found... Show MoreDocument Chaining
What do you do when your model is so big to the point that isn’t usable and you can’t increase resources to your environment? I found that the best solution that worked for me is to split the model into smaller models while you keep one look and feel on the front-end. With this route I wanted my users to have an experience that makes them feel like they are in one app while they are jumping between apps. This brought the need of passing selections between apps. Like any other thing in Qlik it is doable. This is done through your URL on access point.
How it is done:
You will need the exact URL that goes to the model, once you have this you will have to add a simple code at the end of the URL to tell it what selections to pass or which sheet it should go to.Passing Selections
- E.G. link &select=field, value &select=field2, “Value 2”
Link: This is the link that goes straight to your QlikView app.
field : This is the field ID you want to select when you get to the app. (E.G LB01)
Value is what you want to select when you get there. E.g. if you want to select a year you just put 2011.
If your value has more than word e.g. South Korea. You will need to use “” else it will do a fuzzy search. Looking for anything that has south and anything with Korea, meaning you might end up selecting North Korea, South Korea, South Africa.
Everything else you leave as is.This example will be as follows:
Link&select=LB01,2011&select=LB02,”South Korea”Landing Sheet
- E.G. link &Sheet=value
Link: This is the link that goes straight to your QlikView app.
Value: This is the Sheet ID of the Sheet you want to land on. E.g. (SH01)The above example will look as follows
link&Sheet=SH01Below is a link to a video by Qliktips
https://www.youtube.com/watch?reload=9&v=ESSvm_xMTlE -
Let's read Qlik
Greetings to all.I love Qlik, but lately I do not have enough time to keep track of everything that happens.I have to visit many resources for reading... Show MoreGreetings to all.
I love Qlik, but lately I do not have enough time to keep track of everything that happens.
I have to visit many resources for reading news, articles, tricks, videos.
I set myself the goal of being aware of everything, and spend no more than 5 minutes a day on it.
What can help us with this, of course RSS!
For a long time I tried to find a decent and at the same time a simple program for reading rss's ... and found - QuiteRSS (https://quiterss.org/).
Then I started to compile a list of interesting sites for me and add them to QuiteRSS.
At the moment, there is no particular hierarchy of feed, but I think that it will be needed.
Yes, I am sure that there are other sources of information, but I have not found them.
I propose to work on this issue together and lead an acute list.
Git Repo : https://gitlab.com/bintocher/QlikRSS
Can't attach new file, so link : https://gitlab.com/bintocher/QlikRSS/raw/master/qlik%20docs.opml
Updated 2019.01.22 - now total 53 rss feeds ; updated qlik community rss links
-
Use Silent Legend with Cross Colors
When I create a dashboard to mantain a good layout and to offer a good user experience always I need to set the same color for the same dimension valu... Show MoreWhen I create a dashboard to mantain a good layout and to offer a good user experience always I need to set the same color for the same dimension value in each chart.
Unfortunally there isnt' a easy way to do this, and often a solution is to create some additional fields (R,G,B) for each dimension.
I don't like to have dozens of fields in my model with the problem to naming them.
To turn around this problem, I writed a single expression in a variable that doing all for me and now I use it always.
Let's see if you like this method too.
The idea is to use the functions Pick(Match(...)) to realize the magic.
I use QlikView Test Script and Qlikview Components library to realize an example. Test Script create the dimensions Dim1, Dim2, Dim3 and the expressions.
For Dim1 the values are A, B, C
For Dim2 the values are a, b, c, d, e, f
For Dim3 the values are X, Y, Z
For each values in dimensions need to set a variable with the associate color, to do easy this I use ColorTheme.xlsm file and use Qvc.ColorTheme to read it.
Now the best point... our function Pick(Match(...)), that I called App.Color.GetForField and set the value in Settings.xlsx.
Here the value:
=Pick(Match(Only($(=$1)), ' & Chr(39) & Concat({1} DISTINCT $(=$1), Chr(39) & Chr(44) & Chr(39)) & Chr(39) & '), ' & PurgeChar( Replace( 'App.Color.v.Dimension.$(=$1).' & Concat({1} DISTINCT $(=$1), chr(10) & ',App.Color.v.Dimension.$(=$1).') , ' ', '_'), '[]') & ')'
To use it in a chart write $(=$(App.Color.GetForField('[Dim1]'))) in the expression's backgroud property
The values in specificated dimension get automatically choosed color.
I hope you like this.
Regards
Luca Jonathan Panetta
-
J'ever try ta loop a QlikView input load... and have this happen??
I'm a huge fan of the placeholder table and forced concatenation by explicit naming. I can speak a little to the evolution of this technique, as I'm ... Show MoreI'm a huge fan of the placeholder table and forced concatenation by explicit naming. I can speak a little to the evolution of this technique, as I'm a big iterator, and enjoy iteration, even in its most gratuitous forms. Also, I'm big on iteration, enjoying it even gratuitously.
Like many Qlik techniques it starts with the glint of inspiration, devolves into tears, but eventually emerges victorious through perseverance.
So if you're out there trying to collect different inputs in bulk and sequence your load through a series of input files, this post is for you… It may make sense if you've been through a similar history, and personally it has performed as solid defensive programming for myself.
Naturally the first thing you'll want to try is a wildcard load of fields against a wildcard set of files.//Whee!! I'm autoconcatenatin’ the whole stock market with this tight piece of code!
LOAD *
FROM [\HISTORICAL STOCK DATA\SECURITIES_HISTORY_*.QVD](qvd);
And everything is going to work great!
Until... your upstream partner in DB land, who provides your flat file series, but doesn't have that shiny 'Certified Qlik Something or Other' certificate like you do, watches you cruising along without a care in the world, crushing 100's of millions of rows, and mutters "you thought life was gonna be that easy??!".

And then the divergence begins. Drizzling in to your source tables. "What's going on?!" March 2017 has an extra field in it called [GDATE_FLAG], files for Japan & LatAm are missing the field [RD_Code], the entire Q4 data set switched field names from [Division_Cd] to [DIVISION_CD]!!!
Suddenly it dawns on you; wildcard load is now being held hostage by the forces of cooperation.
You decide to put an end to that nonsense and think "I'll identify a finite list of required fields, and get them rock-solid named in requirements! Heh heh!"
//Better not try to mess with THIS rock-solid table structure! Field names are DOCUMENTED!
LOAD Symbol,
Date,
Open,
High,
Low,
Close,
Volume,
[Adj Close]
FROM [\HISTORICAL STOCK DATA\SECURITIES_HISTORY_*.QVD](qvd);
Are you still attempting wildcard looping? Not so fast!! "Wth! Who changed the file naming convention for the 2016 files from YYYYMMDD to MM_DD_YY?! And btw, you dropped a file into the source repository that had a completely new spreadsheet tab name, and wound up busting the load again."
Stick with a set of solid requirements though, because eventually divergence disruptions will reach that ambiguous point where they make the perceived jump from "accidental" to "careless, and possibly subversive".

But mayhem doesn't give up that easily. "You know what I need?" (says Mayhem) "I now need some piece of reasoning or request that causes a preceding load." Proud to show off your Qlik know-how, you slap on that preceding statement and say "See! Qlik can do it!!"
[DA_STOCK_MARKIT]:
LOAD *,
'Nope' As Nope;
LOAD Symbol,
Date,
Open,
High,
Low,
Close,
Volume,
[Adj Close]
FROM [\HISTORICAL STOCK DATA\SECURITIES_HISTORY_QN*.QVD](qvd);
Uh-oh.
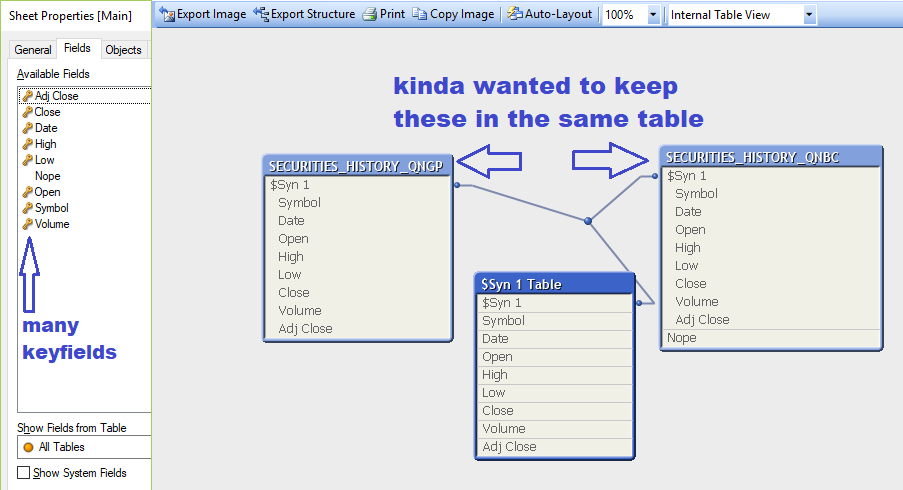
If you had happened to be working with very large tables with lots of fields and high data volumes, and didn't apply tiny row limits to test, the first time you come out of a broken auto-concatenation that results in a full-table synthetic key, let me describe the symptoms:
Your RAM is melting. It is screaming under the mind-boggling strain of forming 'Cartesian of All The Things'. The RAM fills up like the Titanic, and the machine if you're working on a desktop with limited RAM sizing will become sluggish and then unresponsive. A server with a larger headroom, maybe it will last a little longer. Then those data permutations reach virtual memory and you have to wait.. longer than Gandalf waits as he emerges from his battle with the Balrog (“Balrog”? Just "Balrog"? Or "THE Balrog"?).

You might at the end of that eternity, get responsiveness back. Whatever you do, do NOT begin making selections in the user interface once it unfreezes! Reduce data, close out! Close out!!
**extra-credit if you realized what was happening in time to save the RAM, and force-closed Qlik via task-manager, but then realized you didn't have 'Save Before Reload' set.. and lost a bunch of script changes from the hard-close**
If you're smart, you go into your script and make sure that doesn't happen again. If you're me.. your on your 5th bomb out and are as baffled as the first, muttering "I don't get it.. all it was, was a harmless little hardcode field. What's the harm?"
And that's, my fellowes of the Q, is how we arrived at explicitly forced named concatenation.
Now I know what you're thinking "I don't care WHAT is in those tables, they are getting smashed together!" If your process gets fed a listing of elements, an extract from IMDB, and a table scraped from Wikipedia, it don't matter. They're all goin in the same table!
[SQUASH_IT_TOGETHER]:
LOAD '' AS PLACEHOLDER AUTOGENERATE(0);
FOR EACH vRandoFile IN FileList('TOTALLY_RANDOM_FIELD_LISTS\*.QVD')
CONCATENATE(SQUASH_IT_TOGETHER)
LOAD * FROM
[$(vRandoFile)] (qvd);
NEXT
(Mayhem) “Muauahahaa!! I’m not out of tricks! Let's blend up the file extensions!”
[SQUASH_DIFFERENT_FILE_TYPES_TOGETHER]:
NOCONCATENATE LOAD '' AS PLACEHOLDER AUTOGENERATE(0);
FOR EACH vRandoFile IN FileList('TOTALLY_RANDOM_DATA_FILES\*.*')
Let vExtension = Left(Upper(Subfield('$(vRandoFile)','.',-1)),3); //hopefully you're not naming data files 'Hows_bout.txt.them.csv.apples'
SWITCH '$(vExtension)'
CASE 'QVD'
Set vFormatString = (qvd);
CASE 'CSV'
Set vFormatString = (txt, codepage is 1252, no labels, delimiter is ',', msq);
CASE 'XLS'
Call GetExcelTypeSheetandFieldSequence('$(vRandoFile)')
For each $(vSheet) in $(vSheets)
CONCATENATE(SQUASH_DIFFERENT_FILE_TYPES_TOGETHER)
LOAD *
FROM [$(vRandoFile)]
($(vFormatString), table is [$(vSheet)]);
Next //excel sheet
CASE 'TXT','PIP','QVO','TAB'
Call TryToLearnTheDelimiterByReadingSmallSample('$(vRandoFile)')
Call AttemptAFieldListingFromGleanedDelimiter('$(vDelimiter)')
Call TestForFileEncodingJustToBeSure('$(vRandoFile)')
CONCATENATE(SQUASH_DIFFERENT_FILE_TYPES_TOGETHER)
LOAD $(vFlatFileFileList)
FROM [$(vRandoFile)]
$(vFormatString);
DEFAULT
CONCATENATE(SQUASH_DIFFERENT_FILE_TYPES_TOGETHER)
LOAD [@1:n] AS JUST_THROW_IT_ON_THE_HEAP
FROM [$(vRandoFile)] (fix, utf8, no labels);
END SWITCH
IF Match(‘$(vExtension)’,’QVD’,’CSV’)>0 THEN
CONCATENATE(SQUASH_DIFFERENT_FILE_TYPES_TOGETHER)
LOAD * FROM [$(vRandoFile)]
$(vFormatString);
END IF
NEXT
“At this point, valiant programmer, you have done your due diligence. I free you from further obligations... your project is cancelled. Sincerely, Wernstrom Mayhem”

** And lastly.. for extra-credit: someone asked “why NOCONCATENATE the humble 0 row placeholder table?”
Because they will VANISH (if you're not paying close attention)
If you’re lucky you will discover this just after the script phase where it completed a long load of transactions in tens of millions, nee hundreds of millions of rows, attempted all in one gulp. The script gallantly cavorts onward to the [Accounts] table. CONCATENATE [Accounts]..... bzzzzzt!
[Trans]:
Load '' as ID autogenerate(0);[Accounts]:
Load '' as ID autogenerate(0);
/* script, script, script...
...
...
...
many script tabs later
*/
//Hey, time to sequence through the Account files
//Glad I made my innocent placeholder table use the same key field as my Trans table, they are associated so that should be just fine.
CONCATENATE(Accounts)
...//Nope.
-
Calculating net requirements: spread available stock until depletion
Hi,I just like to contribute a little demo that is quiet easy to understand. It could be used for calculating production demands for example.In other ... Show MoreHi,
I just like to contribute a little demo that is quiet easy to understand. It could be used for calculating production demands for example.
In other words: as long as there's available stock, nothing needs to be produced or ordered. I didn't find any similar solution within the community, so I just post it...
If you load one preceeding load after the other you'll understand how it works. The basic trick is to fill the field "AVAILABLE_STOCK_DEPLETED" with the current partnumber. So you're able to recognize that the stock of a certain partnumber ist depleted...
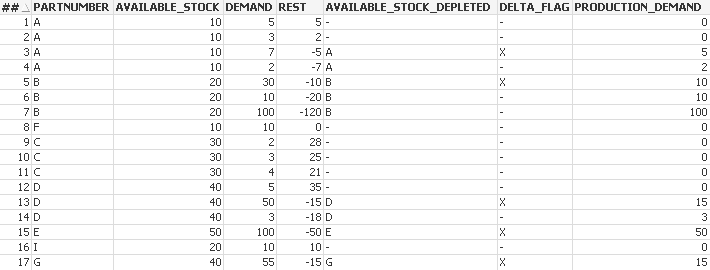
TEMPTABLE:
LOAD RowNo() as ##,* INLINE [
PARTNUMBER, AVAILABLE_STOCK, DEMAND
A, 10, 5
A, 10, 3
A, 10, 7
A, 10, 2
B, 20, 30
B, 20, 10
B, 20, 100
F, 10, 10
C, 30, 2
C, 30, 3
C, 30, 4
D, 40, 5
D, 40, 50
D, 40, 3
E, 50, 100
I, 20, 10
G, 40, 55
];
NoConcatenate
FINAL:
LOAD
*,
if(REST>=0,0,
if(DELTA_FLAG='X',-REST,DEMAND)
) as PRODUCTION_DEMAND
;
LOAD
*,
if(not isnull(AVAILABLE_STOCK_DEPLETED) and AVAILABLE_STOCK_DEPLETED<>Previous(AVAILABLE_STOCK_DEPLETED),'X') as DELTA_FLAG
;
LOAD
if(REST<0,PARTNUMBER) as AVAILABLE_STOCK_DEPLETED,
*
;
LOAD
##,
PARTNUMBER,
AVAILABLE_STOCK,
DEMAND,
if(PARTNUMBER<>Previous(PARTNUMBER),
RANGESUM(AVAILABLE_STOCK,-DEMAND),
RANGESUM(AVAILABLE_STOCK,-DEMAND,-Peek('TEMP'))
) as REST,
if(PARTNUMBER<>Previous(PARTNUMBER),
DEMAND,
Rangesum(DEMAND,Peek('TEMP'))
) as TEMP
Resident TEMPTABLE;
DROP Table TEMPTABLE; -
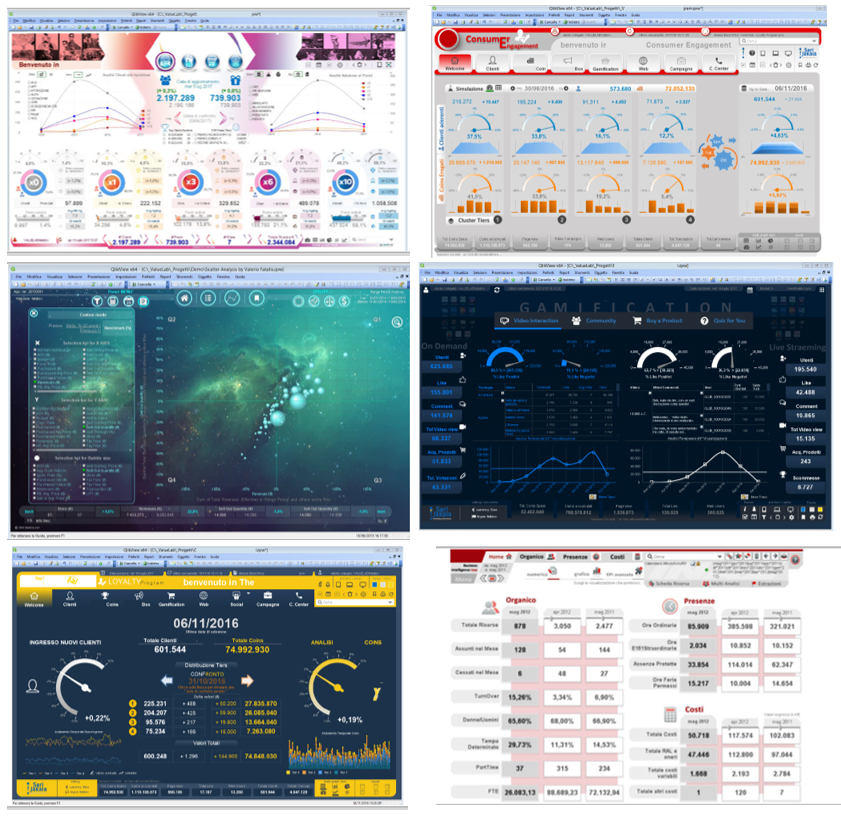
QlikView: The Mirable Miracle Use of Pixel Perfect Developer Work Space...
QlikView: A Wonderfull User Experience!!The Mirable Miracle of Pixel Perfect Developer Work Space...Some my personal "best practice" document to UI wi... Show MoreQlikView: A Wonderfull User Experience!!
The Mirable Miracle of Pixel Perfect Developer Work Space...
Some my personal "best practice" document to UI with mustache!:
A User Experience with Big <U > ! The DashBoard with mustache!
15K Mirable New Collection Icons with Mustache by Valerio Fatatis.rar
Qlik Library Objects by Valerio Fatatis with MUSTACHE! ver 3
10.000 WONDERFULL IOS Icons with Mustache by Valerio Fatatis
Pre Sales Demo App with Mustache by Valerio Fatatis.qvw
QlikView UI Best Practice by Valerio Fatatis Ridotta.pdf
QlikTemplate_Ver_1 by Valerio Fatatis ValueLab.qvw
A Rapid "Fast Calendar Selections...", a great boost of multi periods analysis! ...
Working & Project in Qlikview
How to make a fantastic graphics, amazing to win! with Mustache by Valerio Fatatis
10.000 WONDERFULL IOS Icons with Mustache by Valerio Fatatis
Optimize Configurator in the ALL Projects activity planning V2
Pre Sales Demo App with Mustache by Valerio Fatatis.qvw
Sales Analize with MUSTACHE! by Valerio Fatatis.qvw
Performance Advanced Analysis with Mustache by Valerio Fatatis.qvw
QlikView Advanced UI Design and more...
David and Goliath by Valerio Fatatis.qvw
-
Multicurrency
Being able to display data in different currencies has become a must have feature for business intelligence and analytics apps.So far I was not able t... Show MoreBeing able to display data in different currencies has become a must have feature for business intelligence and analytics apps.
So far I was not able to find a solution that fits all purposes, but I have come up with 2 approaches that can be used alternatively depending on context and user needs. Attached you can find a very basic example for both approaches.
So far I was not able to find a solution that fits all purposes, but I have come up with 2 valid approaches that can be used alternatively, depending on context and user needs. Attached you can find a very basic example for both approaches.
In both cases you will find 2 concepts: Local Currency and International Currency. The first is what the source systems provide and it tells you what currency was used for the transaction that has been recorded. The International Currency, on the other hand, is a reference currency created by QV (or by an OLAP system in general) to reconcile different transactions.
You can choose to have more than one International Currency in your OLAP system and the resources to calculate and store each of them will scale linearly as the effort needed for implementation and maintenance.
Approach 1 - Runtime conversion: This approach consists in converting everything to the international currency in the ETL and convert again everything to the currency selected by the user at runtime. This approach is very flexible because it will allow to provide analysis in as many currencies as the user needs and it can be easily adapted to work with historical exchange rates. At the same time it could have some scalability and performance issues for very large applications. To go more in detail we will consider an example in which we have a fact table (Sales) which contains the price and the quantity of each product sold. All prices have already been converted to Euro (our International Currency for this example) during the ETL phases.
The fact table is then linked to a dimension table which contains all the exchange rates for the needed currencies. The 2 tables are linked using the International Currency Code and prices can be multiplied by the right exchange rate when needed. For this application to work it is needed to have one currency always selected.
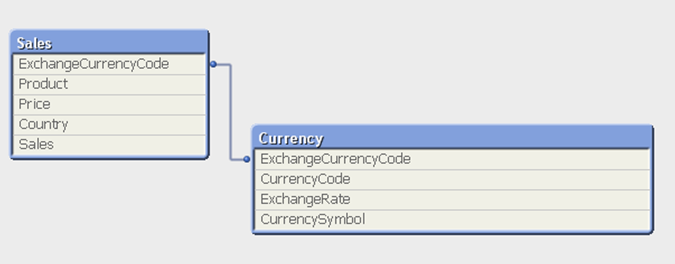
2 variables are calculated in order to display money measures in the right format:
LET vCurrencySymbol = '=Only(CurrencySymbol)'; This variable can be used in charts to show the right currency symbol next to the axis.
SET vMoneyFormatting = "=vCurrencySymbol&' #.##0'"; This variable can be used in all the num() functions to convert the expression to the right formatWhen calculating an expression that should be converted to the selected currency the amount to be displayed must be multiplied by the right exchange rate.
Below an example of an expression to calculate the total revenue:
num(sum((Price*Sales)*ExchangeRate), vMoneyFormatting)
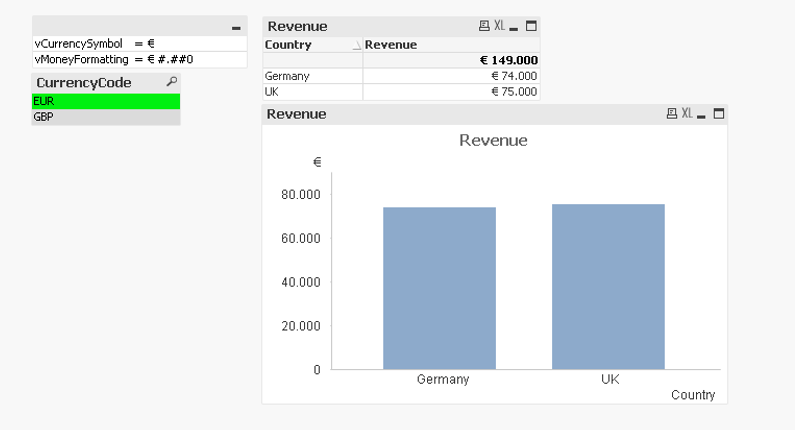
Below an example of an app which is using this approach:
Selected currency: EUR
Selected currency: GBP
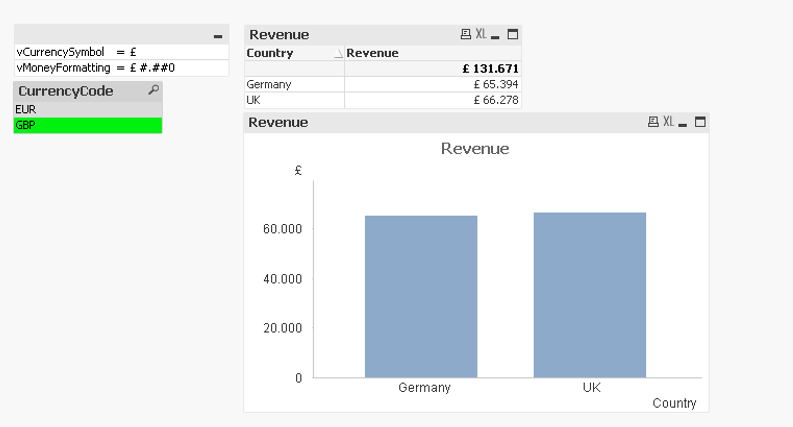
The always one selected value must be checked in the currency ListBox for this approach to work.
Approach 2 - Batch conversion: This approach is less flexible than the one described previously, but it scales better with big applications. In this case currencies won’t be stored in rows but in columns and all currency conversions will be calculated during the batch/reload phase. This means that the application will be faster, but it will be much more difficult to allow users to view data in more than one currency. In the attached example in fact we have assumed that for the end user would be enough to see numbers in Local Currency or in International Currency (in this case Euros). Aggregates of countries which do not have the same currency would be possible only when using the International Currency (you can’t sum Euros and Dollars). At the same time we want our user to be able to switch between Local and International currencies when the Local currency can be used (the user is looking at an aggregation of countries with the same currency).
To use this approach the fact table is enough: there is no need of an additional currency dimension.
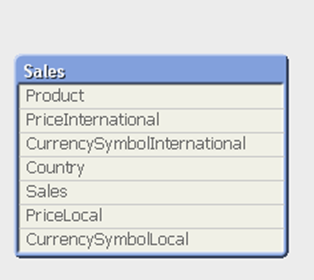
4 columns are needed to use this approach:
- PriceLocal: contains the prices in Local currency
- CurrencySymbolLocal: contains the symbol of the Local currency
- PriceInternationalà contains the prices in International currency
- CurrencySymbolInternational: contains the symbol of the International currency (it will be the same for each row)
5 variables are created in the script of the application:
LET vSelectedCurrency = 'International';
LET vUsedCurrency = replace('=if(vSelectedCurrency=|Local| and count(distinct CurrencySymbolLocal)=1,|Local|, |International|)', '|',chr(39));
SET vPrice = "=if(vUsedCurrency='Local', 'PriceLocal', 'PriceInternational')";
LET vCurrencySymbol = replace('=if(vUsedCurrency=|Local|, Only(CurrencySymbolLocal), Only(CurrencySymbolInternational))', '|',chr(39));
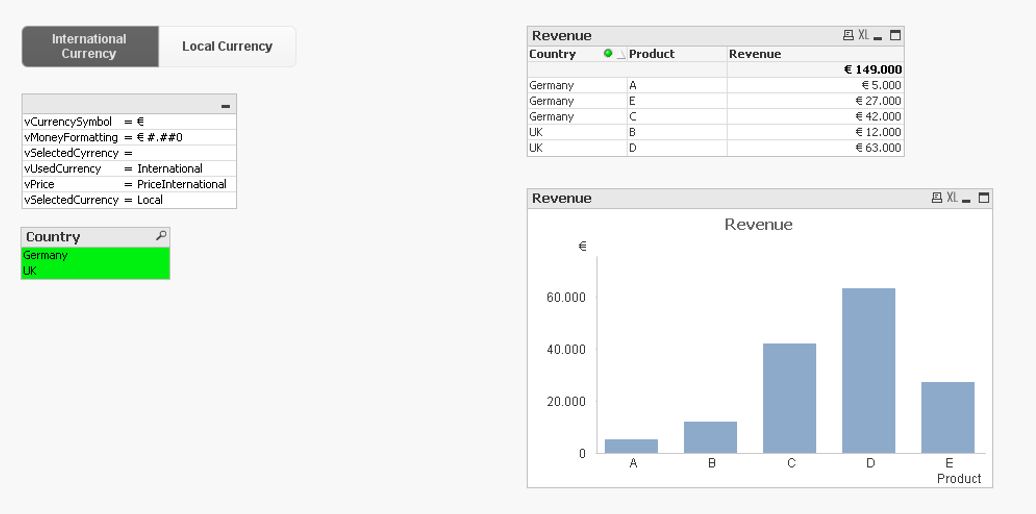
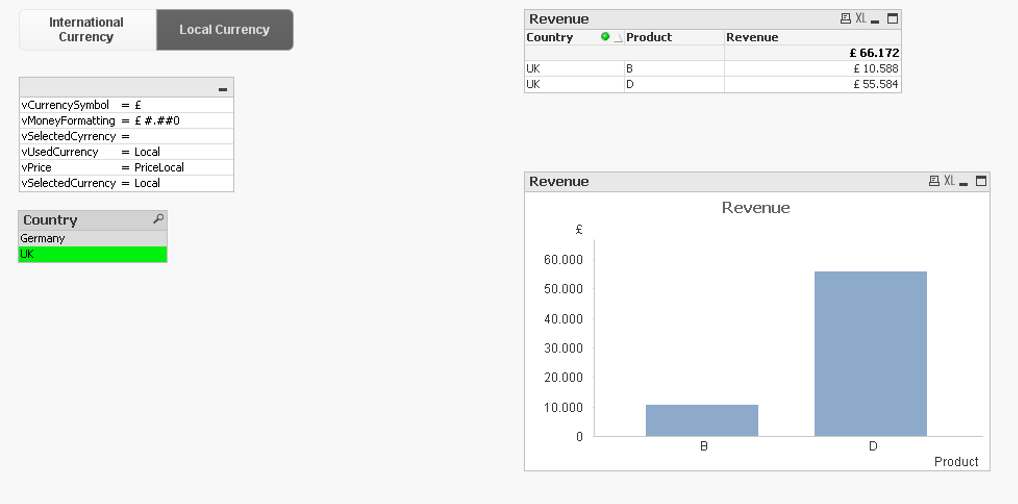
SET vMoneyFormatting = "=vCurrencySymbol&' #.##0'";- vSelectedCurrency à is the currency selected by the user and by default is set to International. This variable will be controlled by the 2 buttons (see the examples for details).
- vUsedCurrency à is going to check whether the Local currency can be used (we only have one local currency available in the current selections) and the currency Type the user has selected. Depending on these 2 conditions this variable tells what currency to be used in the fronted.
- vPrice à depending on the value of vUsedCurrency is used in expressions as a pointer to the right price column: PriceLocal if the user has selected Local currency and a single local currency is available in the selections, International currency otherwise.
- vCurrencySymbol and vMoneyFormatting have the same purpose they have in the first Runtime approach, but they are conditioned by vUsedCurrency.
Below an example of an expression that would calculate the total revenue: num(sum(($(vPrice)*Sales)), vMoneyFormatting)
Finally an example of data displayed in international currency:
and one with local currency selected:
I hope this could be useful.


