Unlock a world of possibilities! Login now and discover the exclusive benefits awaiting you.
Analytics & AI
Forums for Qlik Analytic solutions. Ask questions, join discussions, find solutions, and access documentation and resources.
Data Integration & Quality
Forums for Qlik Data Integration solutions. Ask questions, join discussions, find solutions, and access documentation and resources
Explore Qlik Gallery
Qlik Gallery is meant to encourage Qlikkies everywhere to share their progress – from a first Qlik app – to a favorite Qlik app – and everything in-between.
Qlik Community
Get started on Qlik Community, find How-To documents, and join general non-product related discussions.
Qlik Resources
Direct links to other resources within the Qlik ecosystem. We suggest you bookmark this page.
Qlik Academic Program
Qlik gives qualified university students, educators, and researchers free Qlik software and resources to prepare students for the data-driven workplace.
Recent Blog Posts
-
New Label for Security Notice
Hello Qlik Community, This new label will be used to notify customers about security patches and upgrades available for download. Please subscribe to ... Show MoreHello Qlik Community,
This new label will be used to notify customers about security patches and upgrades available for download. Please subscribe to the 'Security Notice' label to be notified of these updates.
Kind regards,
Qlik Support
-
Concatenate
Concatenate is a prefix that can be used when loading a table in the script. Using concatenate explicitly states that you want the data that is curren... Show MoreConcatenate is a prefix that can be used when loading a table in the script. Using concatenate explicitly states that you want the data that is currently being loaded to be appended to the end of a specified table. According to Qlik Help, the syntax looks like this:
Concatenate is often used when different sets of data, often from different data sources, need to be added to the same table such as a fact table. I often use concatenate when adding new data to a link table in my data model. This is an example of explicitly using concatenate to append rows to an existing table. If the data sets do not have the same data structure, the concatenate prefix must be used, otherwise a synthetic table will be created and the data sets will be store in separate tables. In the script below, the People table is loaded with two fields, Name and Title. The second data set, starting on line 8, is loaded using the concatenate prefix because the field Department does not already exist in the People table. By concatenating the table, the Department field will be added to the People table and the data in the second table will be appended to the end of the People table. The third table, starting on line 15, is implicitly added to the People table and does not require the concatenate prefix because it has the same three fields, Name, Title, and Department) as the new People table.
Below is the resulting table. Notice that the first two rows have null in the Department field because this data is from the initial data set that did not include the Department field.
Let’s look at another example of implicit concatenation. If a table is being loaded with the same fields as an existing table, the data will be appended to the end of the existing table even though the concatenate prefix is not used. For example, below in the script on the left, the data from the table starting on line 8 would be appended to the end of the People table because the second table has the same fields as the People table. This can happen even if these two data sets are loaded in different parts of the script. They do not need to be loaded sequentially. The script below, on the right, using the concatenate prefix will produce the same results explicitly. I prefer to explicitly concatenate to avoid any confusion.
The resulting table will look like this:
In preparing this blog, I learned another way I could load multiple files with the same data structure taking advantage of implicit concatenation. The script below shows how I use the wildcard (*) to load several files with the same data structure.
What I learned is that I can also use a loop and implicit concatenation to do the same thing. After the script below runs, the TempData table will have all the data from the CSV files. The first time through the loop, the TempData table is created and subsequent times through the loop, the data is appended to the end of the now existing TempData table.
After 14 years with Qlik, I am still picking up new things. That is what makes my job so much fun!
Thanks,
Jennell
-
New Year, New Qlik
Hello Qlik Community! Happy Tuesday (or as we have been calling it – Rebranding Day)! It’s a transformative day at Qlik, and we hope you will take a l... Show MoreHello Qlik Community!
Happy Tuesday (or as we have been calling it – Rebranding Day)! It’s a transformative day at Qlik, and we hope you will take a look at the blog our CEO, Mike Capone, posted this morning regarding this initiative.
That brings us to this month's enhancements.
Logo, Colors and Buttons, Oh My!
For Qlik Community, you will see the new Qlik logo, updated coloring on banners, buttons, accepted solutions, etc, along with rounded buttons. Who knew such simple changes could modernize and make a page look so fresh? We are in love with the new changes and hope you enjoy it as well!
More branding updates will be coming soon but let us know what you think of the new changes in the comments below! We are excited to hear your feedback.
Navigation Dividers
The navigation now has dividers to break up the columns.
Clean, Crisp, Mobile Header
The mobile header is looking so crisp! You will only see the new logo, messages, notifications and your avatar.
The three links on the Desktop site - Qlik.com, Qlik Help and Resources – have moved to the hamburger menu.
The ‘Ask a Question’ button is now at the bottom of the page wherever your mobile journey takes you.
As you can tell, it's been a very busy start to the new year. Stay tuned for some new updates next week - we have some VERY exciting changes coming!
You Qlik Community Admins,
Melissa, Sue, Jamie and Nicole
@Melissa_Potvin @Sue_Macaluso @Jamie_Gregory @nicole_ulloa
-
新しい Qlik ブランドをご紹介します
ブログ著者:Mike Capone(本ブログは Revealing The New Qlik Brand の抄訳です) 市場は変わりました。そして私たちはその準備ができています。 今日、Qlik はブランドとウェブサイトを一新し、エキサイティングな旅を続けます。この変革は見た目にとどまらず、デ... Show Moreブログ著者:Mike Capone(本ブログは Revealing The New Qlik Brand の抄訳です)
市場は変わりました。そして私たちはその準備ができています。
今日、Qlik はブランドとウェブサイトを一新し、エキサイティングな旅を続けます。この変革は見た目にとどまらず、データ統合、分析、AI の最前線における私たちのダイナミックな進化を象徴するものです。私たちの新しいブランドは、革新性、明快さ、敏捷性を象徴しています。
現在、最高経営責任者(CEO)は AI を効果的に活用するという大きな課題に直面しています。柔軟でベンダー非依存なソリューションを提供する能力と、大規模に AI を拡張してきた豊富な経験を併せ持つ Qlik は、AI の複雑性を乗り越えるための不可欠なパートナーです。
この新しいブランドは、単に外観を変えるものではありません。現実的な AI ソリューションを切望している市場に対し、当社の役割を新たに示すものです。つまり、私たちのコミットメントー企業がデータ活用を通じた変革で真のビジネス成果を得るという変化の時代をリードするーの大胆な宣言なのです。
Qlik の変わらない目的と自身のルーツからの進化
1993年に「QuikTech」として創業した Qlik は、品質(Quality)、理解(Understanding)、相互作用(Interaction)、知識(Knowledge)の基本的な価値観によって定義された旅の始まりでした。初期にはすでに Quik から Qlik に変わりましたが、私たちの旅の目的は常にデータソリューションを超えるもの、つまり戦略的なビジネス成果を提供することだったのです。
この新しいブランドで、複雑なデータソリューションをより直感的でアクセスしやすいものにしたいと考えます。このロゴのフレッシュでモダンなタイポグラフィとその合理的なデザインは、明快さと効率性への誓いであり、当社の高度なソリューションがユーザー中心であり続けることを宣言するものです。
Qlik の象徴であるグリーンを新しいロゴにも採用した理由は、お客様やパートナー様の心に深く響くものであることが、私たちの調査からも証明されています。このグリーンは単なる色ではなく、成長と機会を表すものであり、データ分析を通じてビジネスを強化するという当社のコミットメントを反映しています。このグリーンは、躍動、革新、そして進化し続けるデータテクノロジーへの当社の適応性を意味しています。
Talend社の戦略的買収は、データ管理、品質、分析、AI/MLのあらゆる機能を統合するマイルストーンであり、Qlik の成長の鍵です。グリーンとグレーを基調とした新しいデザインの Qlik ロゴは、この統合を反映し、Talend の円のモチーフと呼応し、統合と発展を意味しています。
「データがあるところに機会はある」という新しい企業理念が新しいロゴと並んで掲げられています。これは、データを戦略的資産として見なすという市場のトレンドを反映しています。当社のお客様は、データ統合、分析、AI/MLの包括的なソリューションを提供する当社の拡張されたポートフォリオにより、これらの機会をいままさに解き放とうとしています。当社はこの戦略的な位置づけにより、単なるツールプロバイダーではなく、データ主導の世界におけるビジネス変革の実践者となるのです。
直感的でユーザー中心の新しい外観
リブランディングの要であるウェブサイトのリニューアルは、この進化を反映します。製品中心の視点を超えて、当社の多様な顧客ベースに響くソリューションと成果にスポットライトを当てています。この変革は、専門知識の有無にかかわらず、すべてのユーザーにとってデータ分析の旅を直感的でわかりやすいものにするという私たちのビジョンを具現化したものです。
*新しい日本語サイトの公開は今春を予定しています。
ウェブサイトは、当社のサービスをダイナミックに紹介し、洞察とデータ探索のハブとして発展してきました。このウェブサイトは、データ分析の複雑さを解明し、当社の洗練されたソリューションにアクセスしやすくし、十分な情報に基づいた意思決定の文化を育み、イノベーションおよびユーザー中心主義へのコミットメントと当社のデジタルプレゼンスを一致させることを目的としています。
新時代の到来: あらゆる面をブランドに統合
Qlik のリブランディングは、単なる美しさの追求ではなく、お客様や市場の進化する要求に応えることを示すものです。私たちは、デジタルプレゼンスからお客様との対話に至るあらゆるタッチポイントにこの新しい外観を統合することで、Qlik という存在が一貫性を保ち、ユーザー中心の理念が示されるようにしています。
この変革は、お客様やパートナー様とのコラボレーションでもあります。新しいブランドは、私たちがサービスを提供する皆様との対話、あるいは共同の旅なのです。Qlik という存在は、皆様と密接に協働することで、お互いの成長と進化を反映しながら、より豊かなものとなるのです。
新しく生まれ変わった私たちのブランドは、最先端のテクノロジーとビジネスに改めてコミットします。お客様のデータジャーニーにおける触媒となり、実質的なビジネス成果のための洞察を提供することをお約束します。新しいというだけでなく、イノベーション、明快さ、そしてデータ業界における具体的な成果を示す道標でもある新しいブランドのもとで、このワクワクする進化をご一緒しませんか。
-
Qlik Sense Enterprise for Windows - New Security Patches Available Now
Edited 20th November 2023: CVE number updated.Edited December 1st 2023: Added November 2023 IR release Hello Qlik Users, A security issue in Qlik Sens... Show MoreEdited 20th November 2023: CVE number updated.
Edited December 1st 2023: Added November 2023 IR releaseHello Qlik Users,
A security issue in Qlik Sense Enterprise for Windows has been identified, and patches have been made available. Details can be found in the Security Bulletin Critical Security fixes for Qlik Sense Enterprise for Windows (CVE-2023-48365).
Today, we have released eight service releases across the latest versions of Qlik Sense to patch the reported issues. All versions of Qlik Sense Enterprise for Windows prior to and including these releases are impacted:
- August 2023 Patch 1
- May 2023 Patch 5
- February 2023 Patch 9
- November 2022 Patch 11
- August 2022 Patch 13
- May 2022 Patch 15
- February 2022 Patch 14
- November 2021 Patch 16
No workarounds can be provided. Customers should upgrade Qlik Sense Enterprise for Windows to a version containing fixes for these issues. The listed fixes also address CV-2023-41266 and CVE-2023-41265 (link).- November 2023 IR
- August 2023 Patch 2
- May 2023 Patch 6
- February 2023 Patch 10
- November 2022 Patch 12
- August 2022 Patch 14
- May 2022 Patch 16
- February 2022 Patch 15
- November 2021 Patch 17
This issue only impacts Qlik Sense Enterprise for Windows. Other Qlik products including Qlik Cloud and QlikView are NOT impacted.
All Qlik software can be downloaded from our official Qlik Download page (customer login required). Follow best practices when upgrading Qlik Sense.
Qlik provides patches for major releases until the next Initial or Service Release is generally available. See Release Management Policy for Qlik Software. Notwithstanding, additional patches for earlier releases may be made available at Qlik’s discretion.
The information in this post and Security Bulletin Critical Security fixes for Qlik Sense Enterprise for Windows (CVE-2023-48365) is disclosed in accordance with our published Security and Vulnerability Policy.
Clarifications and Frequently Asked Questions:
What can be done to mitigate the issue?
No mitigation can be provided. An upgrade should be performed at the earliest. As per Qlik's best practices, the proxy should not be exposed to the public internet, which reduces the attack surface significantly.
What authentication methods are affected?
All authentication methods are affected.
Are environments with HTTP disabled impacted?
Environments will be affected regardless if HTTP or HTTPS are in use. These vulnerabilities affect the HTTP protocol overall, meaning even if HTTP is disabled, the environment remains vulnerable.
These attacks don’t rely on intercepting any communication, and therefore, are indifferent whether the HTTP communication is encrypted or not.
Kind regards, and thank you for choosing Qlik,
Qlik Global Support
-
Ctrl-Q
Ctrl-Q Ptarmigan Labs Ctrl-Q is an open source (free!) tool that makes life easier for Qlik Sense admins and developers. How? By automating the ... Show MoreCtrl-QPtarmigan Labs
Ctrl-Q is an open source (free!) tool that makes life easier for Qlik Sense admins and developers.
How?
By automating the boring stuff:- View task dependencies as network diagrams, trees or tables
- Viewing and deleting user sessions on the fly. Individual sessions can be deleted, as well as all sessions connected via a virtual proxy.
- Exporting reload task definitions to disk files
- Creating reload tasks from definitions in a Excel or CSV file
- Importing apps from disk and create associated reload tasks
- Show (and optionally store to disk) definitions for master dimensions and measures
- Import master dimensions and measures from definitions in an Excel file
- Delete master dimensions and measures from Sense apps
- Update custom properties for multiple tasks
- Show (and optionally store to disk) definitions for all bookmarks in Sense apps
- Show (and optionally store to disk) definitions for all variables in Sense apps
- Scramble fields in Sense apps
- Get load script for Sense apps
https://ctrl-q.ptarmiganlabs.com
https://ptarmiganlabs.comCtrl-Q runs on Windows, Linux and macOS.
Works with client-managed Qlik Sense Enterprise on Windows.Reload tasks visualised by Ctrl-Q

Discoveries
Using Ctrl-Q's network view for reload tasks, it is possible to get an overview of hundreds or thousands of tasks, as well as drill into the details of individual reload and external program tasks. More info and examples here: https://ptarmiganlabs.com/visualising-qlik-sense-reload-tasks-using-ctrl-q/
Impact
Manually managing dozens or hundreds of apps and associated tasks, apps and master items can both take lots of time and be prone to manual errors. By using Ctrl-Q's bulk export and import features for apps, tasks, master items and variables, Sense developers and admins can both save time and achieve more consistent and higher-quality work results. Achieving more in less time, simply. Examples here: https://ptarmiganlabs.com/ctrl-q-3-14-bulk-task-export-import-for-qlik-sense/
Audience
Qlik Sense developers and admins.
Data and advanced analytics
By automating creation of master items (dimensions and measures) the risk of incorrectly defined master items is greatly reduced, leading to better quality Sense apps that ultimately serve the business better.

-
Macquarie University Workshop
The Academic Program hosted a Qlik Sense workshop for students at Macquarie University in Australia! The University joined the program in 2016 when P... Show More
The Academic Program hosted a Qlik Sense workshop for students at Macquarie University in Australia! The University joined the program in 2016 when Professor Dominic Soh introduced Qlik Sense to his undergraduate students in an Auditing and Assurance Services course. Since the university joined, there have been more than 300+ students accepted into the program, all who have received free software and training for a full year!
Professor Soh uses Qlik Sense to teach data analytics, specifically within the accounting/auditing context. He utilizes the programs free resources which have helped him train his students and build his curriculum. In the course, students are assigned to watch 5 QCC videos and take 5 quizzes each week, and are also required to use Qlik in their final assignment.
The free resources combined with the workshops that the program provides have proven to be really valuable to the professor and the students at Macquarie University!

-
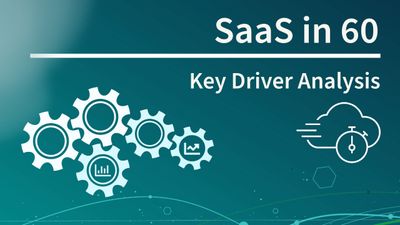
Introducing Key Driver Analysis - SaaS in 60
This week we introduce Key Driver Analysis, a new capability that leverages the power of Qlik AutoML to surface the most influential factors that are... Show MoreThis week we introduce Key Driver Analysis, a new capability that leverages the power of Qlik AutoML to surface the most influential factors that are driving an organizations outcomes in their analytics. Users can simply right click on a chart to initiate a key driver analysis and then specify a target measure and specific features they want to include. The AutoML engine will then generate an analysis that shows the fields in your data model that are most affecting the target measure, complete with visualizations and Natural language generated insights. You can see the key drivers ranked by importance, and can further select each one to get a breakdown and distribution of the values and their influence. With key drivers, users can better understand the reasons for historical results, not just the what but the why, providing deeper insight and supporting more meaningful action
Resources:

-
Embedding Qlik Analytics and the End of Third-Party Cookies
Hello everyone, Google finally set Q3 2024 as the date for 100% blocking all content relying on third-party cookies rendered on web pages in Chrome. A... Show MoreHello everyone,
Google finally set Q3 2024 as the date for 100% blocking all content relying on third-party cookies rendered on web pages in Chrome. At Qlik, the date is not a surprise to us, and to all our customers who embed Qlik Sense, we appreciate your collaboration and patience.
What does this mean for my embedded analytics?
Qlik has been working hard for two years to prepare our products to handle this change and the impact it has on your end users. We've documented additional information for you, which we believe will help you understand how to best configure Qlik Cloud and Qlik Sense Enterprise Client-Managed and keep embedded analytics working smoothly with your web applications and mashups.
Read all about it in Need to Know: Embedding Qlik Analytics and the End of Third-Party Cookies.
Thank you for choosing Qlik,
Qlik Support -
Happy New Year from the Qlik Academic Program!
Happy New Year from the Qlik Academic Program! Throughout 2023 we continued to support our educators and students around the globe with our amazing fr... Show MoreHappy New Year from the Qlik Academic Program! Throughout 2023 we continued to support our educators and students around the globe with our amazing free software and resources. We supported universities with guest lectures about the importance of analytics, as well as hands on workshops in which students build their first Qlik Sense application. We continued to host global webinars to spread the word about our resources and we worked closely with our wonderful 2023 Educator Ambassadors to learn about how they use our program in their teaching.
Here is some of the feedback we received during 2023:
Thrive in the educational odyssey with Qlik's Academic Program! A dual triumph for educators and students alike, this program is a crucible where analytical prowess is forged, giving a formidable edge in the competitive job market. - Nicolaus Copernicus University in Toruń
Easy to use with good explanations - UC Leuven-Limburg
Qlik Academic Program meets my professional needs, gives our students free Qlik software and resources to become the next generation of data experts - The Bucharest University of Economic Studies
very important and valuable for students learning how to digitalize processes - Hochschule für Technik und Wirtschaft Berlin
I have been using Qlik products in my classes for over 20 years, and they have always been well received and useful as a complement to processes and analytics. - University of Vigo-Centro Universitário de la Defensa Marin
Qlik AP helped me a lot in finishing my Thesis. Thank you for that! - Technische Universität Dortmund
if you'd like to learn more about our program, please go to qlik.com/academicprogram
-
Timeline Chart Demo
Timeline Chart Demo AnyChart Timeline charts let you explore a series of events in chronological order. See all the major features of the Timeli... Show MoreTimeline Chart DemoAnyChartTimeline charts let you explore a series of events in chronological order. See all the major features of the Timeline Chart extension by AnyChart in this Qlik Sense demo appDiscoveries
Delve into multiple options to visualize and customize ranges and moments, set markers and labels, configure axes, navigation, tooltips, and much more demonstrated in action.
Impact
Timeline charts ensure an illuminating overview of a series of events in chronological order.
Audience
Data visualizers and analysts seeking to create compelling timeline charts within their applications in Qlik Sense.
Data and advanced analytics
This app features timeline visualizations powered by AnyChart's Timeline Chart extension for Qlik Sense, using fictional data to illustrate its capabilities.
-
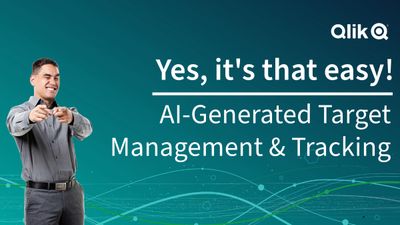
Yes! It's That Easy - AI-Generated Goal Management and Tracking with Insight Adv...
Insight Advisor Insight Advisor is your AI assistant that provides AI-generated charts and dashboards based on your needs, using capabilities such as:... Show More
Insight AdvisorInsight Advisor is your AI assistant that provides AI-generated charts and dashboards based on your needs, using capabilities such as:
- Natural language search
- Field point and click exploration
- Pre-configured Analysis Types
Analysis Types
Analysis Types are displayed as a list of tiles which represent predefined analyses. These analyses can answer a variety of questions and are categorized which include:
- Ranking
- Breakdown
- Comparison
- Geospatial
- Smart Sheets: (pre-defined dashboards)
- and so much more
Did you know you can jump start your analytics creation OR even get additional answers to business questions by using Insight Advisor Analysis types? Insight Advisor capabilities are not just for initial creation of dashboard content.Video
See how AI-enhanced Insight Advisor Analysis Types: Smart Sheets can automatically generate an interactive performance management dashboard to keep track of your goals in just a few clicks. Yes it is that easy!
Feature: Insight Advisor Analysis Types
Analysis Type: Smart Sheet - Period changes (detailed)
Required: 1 Measure, 1 Dimension, 1 Time Period (defined in Calendar periods (Business Logic))
Options:
-Target - values are set using whole numbers to represent percent of previous period
-Colors: RED = Missed, Yellow=Almost, Green=Met.
-Analysis Periods - calendar periods defined in business logicCan't see the video? YouTube blocked by your region or organization? Click here.
Qlik Help: Analysis Types
-
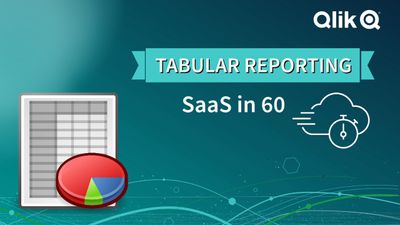
Introducing Tabular Reporting - Create and Distribute Operational Reports
Report developers can use an O365 Excel add-in to create custom, formatted, Excel documents from Qlik data and Qlik visualizations. Governed Report T... Show MoreReport developers can use an O365 Excel add-in to create custom, formatted, Excel documents from Qlik data and Qlik visualizations. Governed Report Tasks can burst these reports, delivering recipient specific data to any stakeholder, with the Qlik platform as the source for business decisions.
Tabular Reporting How To Playlist
And here is my quick Speedrun on setting up Tabular Reporting: (manifest download, OAuth client setup etc.)
https://www.linkedin.com/feed/update/urn:li:activity:7140453571925266433/
-
Qlik Cloud 12月の新機能
分析の新機能 Excel レポートの配信 テーブルを含むExcel 形式のレポートを作成する機能が追加されました。Excel アドインによりExcel上でレポートを作成し、多くの受信者にスケジューリングによって配信することができます。 主な機能 複数シートのレポート作成 軸毎にシート作成 メール... Show More分析の新機能
Excel レポートの配信
テーブルを含むExcel 形式のレポートを作成する機能が追加されました。Excel アドインによりExcel上でレポートを作成し、多くの受信者にスケジューリングによって配信することができます。
主な機能
- 複数シートのレポート作成
- 軸毎にシート作成
- メール配信、Share point フォルダーへの配信
- スケジュール設定による配信
- 複数アプリからの構築 など
前提事項
- Reporting Service のご契約が必要です。
- Qlik Excelアドインは、Microsoft 365内の互換性のあるWeb版およびデスクトップ版のMicrosoft Excelに導入してインストールすることができます。Microsoft 365のデスクトップ版Excelでアドインを使用するには、Windowsオペレーティングシステムが必要です。
- Qlik Excelアドインを実行するには、 ExcelAPI 1.9 以降を備えたMicrosoft Excel がインストールされている必要があります。
境界線と影
ほとんどのチャートで、境界線と影の設定ができるようになりました。
テーマのスタイルとは別に、チャートごとに下記のスタイルを設定できます。
- 境界線の太さ、色、角の半径
- 影の大きさ、色
新しいピボットテーブル
Visuzlization Bundle に新しいピボットテーブルが追加されました。下記の機能が使用できます。
- 軸のヘッダーのスタイリング
- ヌル値のカスタムシンボルと色設定
- グリッドの境界の幅と色設定
- ヘッダーとセルのフォントのスタイリング
- 合計のスタイリングと配置オプション(上または下)
- 列幅のオプション(自動、ピクセル、パーセンテージの設定
- メジャーのインタラクティブな並べ替え
- 外枠、影の設定
レイアウト コンテナ
Dashboard Bundle にレイアウトコンテナが追加されました。チャートを自由に配置、重ね合わせができ、各ビジュアライゼーションの条件による表示コントロールも可能です。
- レイアウト内の複数チャートをまとめて選択、移動
- 新しいビジュアライゼーションとしてチャートを結合
- 複合KPIを作成
- グルーピングしてユーザーコントロールやボタンを再利用
- 美しいダッシュボードレイアウトが可能
Qlik Datagateway – 直接アクセス 新バージョン(1.6.1)
・複数のコネクタプロセスにまたがるリロードのサポート
コネクタプロセスの分離がDirect Accessゲートウェイに追加されました。これはオプトイン機能で、デフォルトではオフになっています。ゲートウェイ・サーバーのオペレーティング・システムに直接アクセスできる管理者は、コネクターの種類ごとにリロードに使用できるプロセスの数を制御できます。複数のコネクタ・プロセスにリロードを分散させると、各コネクタ・プロセスで同時に実行されるリロードの数が減るため、分離レベルが向上します。これにより、コネクタのクラッシュが発生した場合の Direct Access ゲートウェイ全体の安定性が向上します。
・SAP BWを Datagateway-直接アクセス 経由で使用する場合のチャンキングを無効にする機能を追加
SAP BW(Direct Access gateway経由)コネクタ用のBEX_ONE_CHUNKアプリケーションパラメータが導入されています。Qlik CloudからSAP BWに直接アクセスする場合は、パフォーマンスを最適化するために、結果セットはSAPバックエンドでチャンクに分割され、別々のスレッドとして読み込まれます。しかし、Datagateway-直接アクセス経由でSAP BWにアクセスすの場合は、結果セットをチャンクに分割することに実質的な利点はなく、むしろデータ転送の間、追加の一時テーブルを作成する必要があるため、SAPの共有メモリをより多く消費します。SAP コネクタのバイナリ・フォルダにある appsettings.json ファイルで BEX_ONE_CHUNK:false を設定することで、チャンキングを無効にすることができます(通常は必須ではありません)。
・Datagateway-直接アクセス 経由のSAP BW と SAP SQL コネクタの診断機能改善
Datagateway-直接アクセス 経由のSAP BW と SAP SQL コネクタのログについて、ログファイル名に _port が付加されました。また、同じポートでリッスンしているコネクタの新しいインスタンスからのイベントを区別するために、コネクタのログファイルに ProcessID=### メッセージが追加されました。
・再接続の改善
リロード中の再接続メカニズムが改善され、 リロードを開始したポッドに接続する必要がなくなり、 最初に使用可能なポッドに接続されるようになりました。
データ統合の新機能
Microsoft Fabric のサポート(ターゲット)
データパイプライン・プロジェクトでターゲットとして使用できるデータウェアハウスに Microsoft Fabric が加わりました。Qlik Datagateway – 移動 2023.5.15 以降が必要です。
追加の SaaS アプリケーション コネクタ
- Acumatica ERP
- GitHub
- QuickBooks
- SAP Ariba
- SAP Cloud for Customer
- SAP Fieldglass
- SAP SuccessFactors Payroll
- Stripe
- Zoho Books
- Zoho CRM
- Zoho Expense
- Zoho Inventory
- 既存の Oracle OPERA コネクタが更新され、変更データ キャプチャがサポートされるようになりました。
新機能の詳細はこちらからご覧ください。日本語版は翻訳のため少し遅れる場合があります。言語を「英語」に切り替えると最新情報をご覧いただけます。

-
Qlik データゲートウェイ - Direct AccessでファイアウォールやVPCの背後にあるデータへ安全にアクセス
この記事は下記の英語版記事の翻訳です。Securely access data behind a firewall or VPC with Qlik Data Gateway - Direct Access Qlik データゲートウェイ - Direct Accessは、Qlik Cloudへの暗... Show Moreこの記事は下記の英語版記事の翻訳です。
Securely access data behind a firewall or VPC with Qlik Data Gateway - Direct Access
Qlik データゲートウェイ - Direct Accessは、Qlik Cloudへの暗号化された接続を提供し、Qlik Sense SaaSアプリケーションが、企業のネットワークセキュリティを損なうことなく、企業のファイアウォールの内側にあるデータに安全にアクセスして分析することを可能にします。Qlik データゲートウェイ - Direct Accessは、保護されたデータがオンプレミスまたは仮想プライベートクラウドにあるかにかかわらず、Qlik Sense SaaSで安全かつ確実にデータを分析する方法を提供します。
あらゆるレベルの組織が、クラウドをより有効に活用するために、ビジネスシステムとオペレーションのデジタル化および近代化のための大規模な投資を行っています。しかし、すべての企業がビジネスのあらゆる部分を簡単に移行できるわけではありません。規制やファイアウォールの厳格なポリシーによって、一部の業務やデータはファイアウォールの内側や仮想プライベートクラウド(VPC)内に維持する必要があります。
このカテゴリーに属するお客様は、SaaS製品を採用したいが、データはそのままにしておきたい、という狭間で立ち往生しています。幸いなことに、QlikはQlik Cloudをご利用のお客様が、ファイアウォールの内側で息づいているデータに安全かつセキュアにアクセスできる、完全なエンタープライズSaaS分析環境を導入することを可能にしました。
Qlik データゲートウェイ - Direct Accessは、Qlikクラウドへの暗号化された接続を提供し、Qlik Sense SaaSアプリケーションは組織のファイアウォールの内側に存在するデータに安全にアクセスして分析できるようにします。保護されたデータがオンプレミスまたは仮想プライベートクラウドにあるかにかかわらず、Direct AccessはQlik Sense SaaSでそのデータを安全に分析する方法を提供します。
Qlik Cloudは、データがクラウド上にあっても、ファイアウォールの内側にあっても、組織のデータランドスケープに統制されたアクセスを行ってQlik Sense SaaSへのデータ取り込むための、エンタープライズグレードのソリューションを提供します。
How it Works
Qlik データゲートウェイは、データソースからQlik Cloudへのブリッジとして機能し、Qlik Sense SaaSアプリケーションがファイアウォール内またはVPC内のデータに安全にアクセスし、分析することを可能にします。
データゲートウェイは、ファイアウォールの内側にある組織のネットワーク内のシステムにインストールされ、データソースとQlik Cloudのテナントとの間の安全な暗号化された接続を可能にします。データゲートウェイは、HTPPSを使用して相互認証された暗号化された接続を確立します。
Qlik Cloudはゲートウェイにクエリを送信し、ゲートウェイはコネクタで設定された定義済みのデータソースにクエリを中継します。データはデータソースからQlik Cloudに直接転送されます。データは常に転送されており、物理的にGatewayに存在することはないということが重要です。
QMCの左側の「構成」から「データゲートウェイ」を選択すると、ガイドツアーを見ることができます。
Qlik Data GatewayとDirect Accessは、オンプレミスやVPC内に残さなければならないデータをお持ちのお客様のSaaSでのアナリティクス利用を可能にします。
Qlik Cloudは、クラウド導入を加速させる安全なソリューションであらゆるタイプのデータランドスケープをサポートし、お客様が分析の素晴らしさをさらに追求するために必要なイノベーションを提供します。
こちらからデモアプリでお試しいただけます。
-
Testing and using expressions with Master Items
As a new-er member of Qlik’s demo team, I am often learning new approaches to building expressions and visualizations when creating apps. Currently I ... Show MoreAs a new-er member of Qlik’s demo team, I am often learning new approaches to building expressions and visualizations when creating apps. Currently I am working on a college football app that uses a variety of expressions to process the data we’ve loaded. Here I will explain some of the techniques that I have used to troubleshoot my expressions.
In our college football app, we’re bringing in a lot of data from a lot of different places, matching them up, adding them, multiplying, dividing, all manner of things to get the information we need. The primary goal of this app is to find ‘The Greatest College Football Team’. The ‘greatness’ of each team was determined by a combination of factors that combined into ‘Total Points’, the team with the highest amount of points, would be crowned the greatest.To find these ‘Total Points’, we have a formula:
That’s not the longest expression that you will find, you might have created some longer ones yourself, but what are these pieces to this expression? Each portion of this expression is created by a combination of data that we’ve loaded into our app, let’s look at one of them:
Now we’ll get into creating and testing our expression. First, we’ll select a team we’ll be finding the values for, with this example we’ll use 2019 LSU. To ensure that I have the right measures, I create a new sheet in my app, then KPIs for each value in my expression; Total Offensive Yards Per Game, Points Per Game and Offensive Turnovers. This is to ensure I am working with the correct values. Additionally, I add a filter pane to my sheet to select my team.
My Sheet now looks like this:We’ll now double check our values against our source data, and we have a match. Now let’s combine these values into an expression. Add another KPI to sheet, click Add, then the fx to being creating your expression. We’ll now arrive at our expression editor. I often find it helpful to open a second window of your app so you can reference back to KPIs to ensure you’re collecting the correct values.
Now we’ll add our values into the expression in the form of our original equation.
You may notice that these values are in different colors. The light blue/grey colors are master measures, where as the gold are fields directly from our data set. Make sure to include your parenthesis to control the order of operations in the equation. For our example, we want Total Yards and Points Per Game to be added together before being divided by Offense Total Turnovers, so we’ll put parenthesis around them.
Before selecting apply, ensure that Qlik OK’s your equation, this information can be found at the bottom of the expression editor.
Some of the best advice I can offer when troubleshooting an expression is to make sure you have an even number of parenthesis.
Here we have an extra parenthesis, and it is causing us to return an error in our expression. If we remove it, we’ll see that Qlik gives us the OK.
Now we’ll click apply and check the value we returned.
Our sheet should now look like this:
Looking back at our reference data, we’ll see that our expression is working as it should. Venturing back into ‘Edit Sheet’ we can click on the KPI for our expression and open up the measure to find this screen:
At the bottom, we’ll find ‘Master item’ and a button that says ‘Add new’. Click on that to open this menu:
We can now add a name to our expression and click create, turning our expression into a measure that we can use throughout our app.
Now we can do this for all of the sections of our Total Points expression, using the same technique to create the Defense Percentile, Special Teams Efficiency and S.O.S. Percentile, each of these becoming their own measures whose expressions will be below. Our sheet should again have the individual parts of our expression so we can double check the values.
Defense Percentile:
Special Teams Efficiency:
S.O.S. Percentile:
Our new expression will look like this:
Let’s start building. We’ll start with the three measures at the beginning.Remember to add your parenthesis to group these measures and then refer back to your KPI to check that our values are correct.
Perfect! Now we can begin adding onto it. Until our expression is fully filled out.
Then we double-check our values, and then we can make this a measure as well!
Great! Now let’s look at our work, what have we accomplished. Through this process we have taken what would have been this equation:
Into:
A bit easier to work with. And we have checked our values along the way to ensure they are correct. With this, we can use this one small, easy to use measure all over our app without having to worry about a missed parenthesis, or an incorrect value.
-
Troubleshooting Qlik Sense Desktop Authentication
Hello Qlik Users!With the recent change to Qlik Sense Desktop, we have seen some users facing issues with authentication. Users are reporting the foll... Show MoreHello Qlik Users!
With the recent change to Qlik Sense Desktop, we have seen some users facing issues with authentication. Users are reporting the following error message:
Failed to authenticate against the selected server. Please make sure your internet connection is working and try again.
There are a few reasons why this error could occur.
Reason
Solution
The firewall is blocking the required ports.
Contact your local IT/network administrator and ensure that the following URLs can be reached using https (port 443): *qlik.com, *.auth0.com and *qlikcloud.com.
Version of Qlik Sense Desktop.
Verify that you have the most up to date version of Qlik Sense Desktop installed.
A proxy is being used to access the internet.
It may be necessary to bypass the Proxy to log on and authenticate or to contact your local/IT network administrator to ensure the appropriate ports are opened.
A VPN is being used.
Disconnect from the VPN or contact your l local/IT network administrator to ensure the appropriate ports are opened.
The incorrect license was granted in Qlik Sense Enterprise.
A professional or user access license is required to authenticate against Qlik Sense Enterprise.
For more information on these solutions, please see this article. If you have any questions about authenticating against SaaS editions, please see How to authenticate Qlik Sense Desktop against SaaS editions.
Please let us know if you have any questions. If you found this blog useful, please give it a like! Also, subscribe to the Qlik Support Updates Blog by clicking the green Subscribe button.
Kind regards,
Qlik Digital Support
-
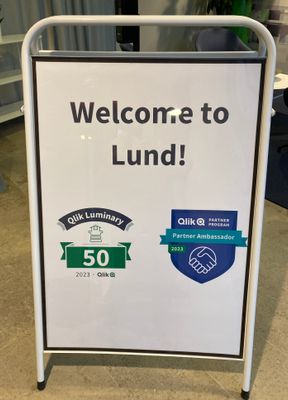
【参加レポート】Qlik Luminary Meetup in Lund
全世界から 40名近くの Luminary が集まり、日本からはホンダ小川様、セガ萬様にご参加いただきました。Qlik からはCEOのマイクをはじめ、ビジネス部門やマーケティングのトップ、製品デザインチームなどが参加しました。 製品戦略やロードマップの説明、開発中のUIのスニークプレビュー、Lu... Show More全世界から 40名近くの Luminary が集まり、日本からはホンダ小川様、セガ萬様にご参加いただきました。Qlik からはCEOのマイクをはじめ、ビジネス部門やマーケティングのトップ、製品デザインチームなどが参加しました。
製品戦略やロードマップの説明、開発中のUIのスニークプレビュー、Luminary と開発チームによるワークショップ、各Luminary の取り組みの発表など盛りだくさんの内容でした。またホンダ小川様が、社内で実際に使われている経営ダッシュボードをご紹介された際には技術トップ陣が熱心に見入っていました。
Qlik はこのミートアップを先進ユーザーの方からフィードバックを聞く重要な場であると同時に、ユーザー同士の情報交換の貴重な場としても位置付けており、多くのディスカッション、会話が生まれていました。
来年の Qlik Luminary はTalendユーザーも対象となり拡大する予定です。また、日本では Qlikアドボケイトを引き続き、募集中です。ご興味のある方はぜひお声がけください。
-
Indoor Map - Factory
Indoor Map - FactoryNTechExample of how we can use Qlik Sense to associate data with an indoor/outdoor map. This example use a chemical factory, but y... Show MoreIndoor Map - FactoryNTechExample of how we can use Qlik Sense to associate data with an indoor/outdoor map. This example use a chemical factory, but you can use with indoor places like a eventes, shows, shoppings and others.Discoveries
View the main points on the factory map, the level of safety risk in each area, classification of factory areas and the number of people working in each location.
Impact
Indoor/outdoors maps are tools that combine art and science to guide, optimize strategies and promote accessibility in indoor or outdoor environments, allowing resources to be allocated efficiently and adopt strategies based on data.
Audience
Discovering data on indoor/outdoor maps: Optimize strategies and promote accessibility in indoor or outdoor environments, allowing you to allocate resources efficiently and adopt data-based strategies.
Data and advanced analytics
Associating data with internal geolocation is a great opportunity to learn more about and look for opportunities in each space of your enterprise.
-
Walking in a Winter Wonderland
Hello Qlik Community! It’s an old cliché, but the year has truly flown by! We are so thankful for each one of you and the excitement you bring to the... Show MoreHello Qlik Community!
It’s an old cliché, but the year has truly flown by! We are so thankful for each one of you and the excitement you bring to the Qlik Community. All your collaboration and engagement motivates us to improve, enhance, and cultivate an educational yet fun experience. We have some big things planned for 2024 and could not be more excited!
As one last surprise, we wanted to spread some cheer and give everyone a “Winter Wonderland” for the Holidays! Should you not enjoy the snow, there is a toggle button on the right-hand side that allows you to disable and enable it.
Wishing you joy, peace, love, and data! We will see you in 2024!
Your Qlik Community Admins,
Melissa, Sue, Jamie, and Nicole