Unlock a world of possibilities! Login now and discover the exclusive benefits awaiting you.
Analytics & AI
Forums for Qlik Analytic solutions. Ask questions, join discussions, find solutions, and access documentation and resources.
Data Integration & Quality
Forums for Qlik Data Integration solutions. Ask questions, join discussions, find solutions, and access documentation and resources
Explore Qlik Gallery
Qlik Gallery is meant to encourage Qlikkies everywhere to share their progress – from a first Qlik app – to a favorite Qlik app – and everything in-between.
Qlik Community
Get started on Qlik Community, find How-To documents, and join general non-product related discussions.
Qlik Resources
Direct links to other resources within the Qlik ecosystem. We suggest you bookmark this page.
Qlik Academic Program
Qlik gives qualified university students, educators, and researchers free Qlik software and resources to prepare students for the data-driven workplace.
Recent Blog Posts
-
統合が進む市場では、データ統合が競争優位を左右する(Qlik Blog 翻訳)
ブログ著者:Drew Clarke 本ブログは「In a Consolidating Market, Data Integration Is Your Control Point」の翻訳になります。 Gartner 社は、「Gartner® データ統合ツールの Magic Quadrant」におい... Show Moreブログ著者:Drew Clarke
本ブログは「In a Consolidating Market, Data Integration Is Your Control Point」の翻訳になります。Gartner 社は、「Gartner® データ統合ツールの Magic Quadrant」において、再び Qlik をリーダーの 1 社として評価しました。Qlik は、今回で 10年連続の快挙を達成しました。この 10年間、データ統合を取り巻く環境は大きく変化しました。大規模なクラウドコンピューティングサービスを提供する企業群は存在感を高め、大手ベンダーは囲い込みを強化してきました。さらに、企業の買収が顧客の選択肢そのものを再編しています。
市場の統合が進んでいる今、最高情報責任者や最高データ責任者が考えるべきポイントが変わってきています。「Magic Quadrant のポジション」よりも、「自社のデータおよび AI 戦略の推進と継続性」が重要になっています。Deloitte 社が実施したグローバル CIO 調査においても同じ方向性が示されました。クラウドや AI を活用した業務が増えているが、ベンダー依存の回避とアーキテクチャの柔軟性の維持が、これまで以上に重要な課題となっています。
リアルタイム・ハイブリッド・オープン
高性能な CDC(変更データキャプチャ)と複製
Qlik のログベースの変更データキャプチャおよび複製は、市場でもトップクラスと評価されています。データベース・メインフレーム・クラウドなど、あらゆる環境間で信頼性の高いリアルタイムの連携を実現します。これにより、ゼロダウンタイムでハイブリッドクラウドへデータを移行することが可能になり、リアルタイムのリスク管理と業務運用をサポートします。膨大なデータの移行と変換
Gartner 社は、膨大なデータやバッチ処理におけるデータ移行と変換機能のパフォーマンスについても高く評価しています。ここで求められるのは、負荷が増大しても安定して動作し、本番環境での想定外のトラブルを最小限に抑制できることです。これにより、日々の運用維持に縛られずに AI や分析といった新たな価値の創出に注力できるようになります。ハイブリッドおよびマルチクラウド対応の幅広いコネクター
Qlik が提供している幅広いコネクター、オンプレミス・クラウド・レイクハウス環境におけるサポートは、小さな機能や細かい仕様に見えますが、実際は運用の柔軟性をサポートする立役者です。ある業務はオンプレミスで、別の業務は AWS / Azure / Google Cloud で実行するといった柔軟な運用が可能になります。また、新しいデータ形式(Apache Iceberg など)を導入する際に、既存の統合戦略を策定し直す必要もありません。ガバナンス・メタデータ管理・AI 活用への対応
Gartner 社は、Qlik のメタデータ管理とガバナンスを市場の平均以上と評価しており、データパイプライン全体の系統・ポリシーの適用・データの流れの可視化などが含まれます。AI がより重要な業務に介入するようになり、データの出所や利用方法における規制当局の監視が厳しくなっている中、こうした機能はオプションではなく必須となっています。
特許取得済みの Qlik Trust Score for AI は、AI がアシストするパイプライン設計や品質チェックにも活用されており、メタデータ管理とガバナンスの基盤で機能します。管理できるデータのみが、自動化と信頼度評価の対象になります。レイクハウスと AI の活用 - 運用の柔軟性も維持
Qlik のオープンレイクハウスや Apache Iceberg の取り込み、圧縮、ハイブリッド複製に関する取り組みは、先進的なレイクハウス戦略を証明するものだと評価されています。Icebergは、複数の処理エンジンで同じデータを共有できるオープンテーブル形式のため、エンジニアリング・コスト効率・リスク管理のすべてにおいて優れています。
管理された Iceberg テーブルに一度データを置くだけで、データウェアハウス・AI・分析ツールで即座に利用できるようになります。複雑でコストを要する複数のデータのコピーを作成する必要はありません。信頼できるデータ製品、オープンなレイクハウスレイヤー、AI がサポートする統合を組み合わせると、無意識にデータ活用にAI を使えるようになります。個別の特別なプロジェクトとして扱う必要はありません。
統合が進む市場での独立性
Magic Quadrant で見落としがちな一行ですが、Qlik は引き続き独立性を維持し、ハイブリッド環境に対応したオープンプラットフォームを提供しています。
もしデータ統合プラットフォームが CRM ベンダーや主要クラウドが所有している場合、プラットフォームはどうしてもベンダーの都合に合わせた設計になります。ロードマップや価格設定、機能やデータ連携の範囲なども影響を受けます。
一方で、独りした統合プラットフォームなら、自由な選択肢と交渉力を確保することができます。クラウドやデータウェアハウスを自由に組み合わせたり、価値に応じて条件を交渉したり、性能・コスト・規制の変化に応じて柔軟に移行することも可能です。これが私が主張したい「自由」です。自社のビジネスに必要なデータファブリックや AI 環境を設計し、状況の変化に応じてゼロから構築し直すこともなく柔軟に変更できる状態なのです。
まとめ
Magic Quadrant の図を度外視すると、今年のレポートで伝えたいことはシンプルです。リアルタイム対応、ハイブリッド環境、オープンアーキテクチャは、今の標準要件となっています。ガバナンスやメタデータ管理、AI 活用の準備は、意思決定の需要な判断基準になりつつあります。さらに、市場の統合が進む中でも、独立性と柔軟性は変わらず重要です。
この Magic Quadrant の評価は、Qlik の取り組みが正しい方向に進んでいることを示しています。CDC や膨大なデータの移行、コネクタ、ガバナンス、レイクハウス、AI 支援の統合といった一貫した取り組みが評価されたと言えます。
データリーダーが重要視していることは、シンプルです。
- 必要な時に、クラウドやデータウェアハウス、基幹システム間で自由にデータを移行できるのか。移行する度にゼロからやり直す必要はないのか。
- データが AI や規制に対応できる状態であることを、明確な系統、ポリシーの適用、信頼の指標で証明できるのか。
- 単一の統合されたデータ基盤を運用しているのか。もしくは分散したツールを寄せ集めた状態なのか。そして、それがコスト、リスク、スピードにどう影響するのか。
こうしたポイントに対応できるのが、Qlik Talend Cloud / Qlik オープンレイクハウス / AI 支援の統合アプローチです。
データ統合ツール分野で 10年連続でリーダーの 1 社に評価された功績を誇らしく感じますが、本当に重要なのは、実際にプラットフォームを使用した際の自由な操作性と管理を実感いただけることです。
-
【新着レポート】Qlik、データ統合ツールで 10 年連続リーダーの 1 社に!
Gartner 社は、「2025年 Gartner® データ統合ツールの Magic Quadrant」を発表しました。Gartner 社が評価した 20 社のデータ統合メーカーの中で、Qlik は 10 年連続でリーダーの 1 社に評価されました。 データはこれまで以上に多くのシステム間で高速で... Show MoreGartner 社は、「2025年 Gartner® データ統合ツールの Magic Quadrant」を発表しました。Gartner 社が評価した 20 社のデータ統合メーカーの中で、Qlik は 10 年連続でリーダーの 1 社に評価されました。
データはこれまで以上に多くのシステム間で高速で移行し、AI 主導の意思決定の要となっています。信頼できるデータ統合基盤は、このような状況を支えるだけではなく、極めて重要なものとなっています。
自社に最適なプラットフォームを選択するには?本レポートで 詳細をご確認ください。-
データ統合市場における Gartner 社 のインサイト
-
Qlik がリーダーの 1 社に評価された理由
-
データ統合市場における各メーカーの評価
-
-
Some of the best Qlik Sense extensions created so far
Since the release of Sense back in September 2014 a lot of good things have happened to the product. If you look back you almost can’t believe that it... Show MoreSince the release of Sense back in September 2014 a lot of good things have happened to the product. If you look back you almost can’t believe that it was just 6 months ago when we launched Sense. Since then, R&D guys and girls have added quite a lot of improvements and new functionality (and more is coming next) into the product.
Today, I don’t want a focus on the company’s centralized development. We talk enough about ourselves here, but on the decentralized Sense development guerrilla from out there. Since January 26 these individuals contributing with a fresh view to Qlik Sense (to QlikView as well) have a place to share their ideas and Open Source projects. It’s called Qlik Branch and it’s open for everyone to join.
From all the projects already submitted to Qlik Branch, I will nominate 3 of my favorites created so far.
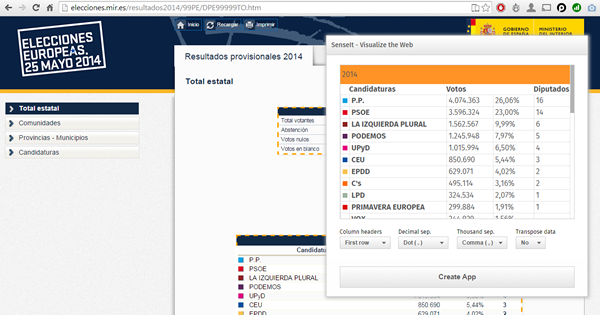
SenseIt by Alex Karlsson
It goes to my personal Top 1 for a variety of reasons but particularly because it opens a completely new and unexplored category for Extensions. We are used to seeing extensions (or visualizations) within the product itself but this is something completely different. SenseIt is a browser extension or plugin that will let you create a new app on the fly by capturing a table from Chrome and loading it as data into your Qlik Sense Desktop. Truly amazing experience and the name is cool too (isn’t it?)
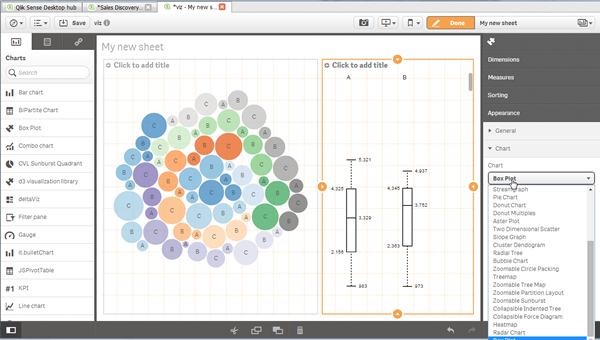
D3 Visualization Library by Speros Kokenes
As a visualization junkie I am, I love D3.js, I truly love some of the beautiful and smart visualizations built around the popular JavaScript library. I have seen (and ported) some of those charts to Sense, one by one, so you end up having a packed chart library on your Sense desktop. Speros have gone a bit further by converting the Visualization object into a truly D3js library where you can go and pick up your favorite D3js visualization, very entertaining. In future releases we might end up having control over the chart colors and some other cool stuff that will make this extension superb, remember you can contribute and make it even better.
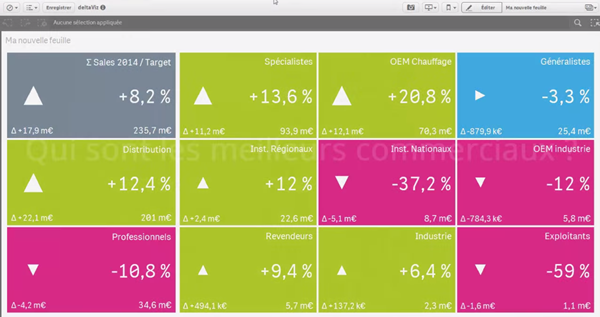
deltaViz self-service dashboard by Yves Blake
For those of us QlikView lovers any addition to the dashboard world in Sense it’s always very much appreciated. If it’s very well executed and designed as it is deltaViz, then there’s no reason to not try it. DetalViz is a complete solution for dashboards focused on comparisons and very well implemented to take advantage of Qlik Sense grid system. If you still have doubts about this visualization, you can see it live here: https://www.youtube.com/watch?v=4s30AEf4qJc
These are my top 3 favorite extensions/visualizations created so far, but what are yours?
AMZ

-
Celebrating a Year of Transformative Learning: Wrapping Up 2025 with the Qlik Ac...
Throughout 2025, the Qlik Academic Program has continued to empower students and educators worldwide by providing free access to our industry-leading ... Show MoreThroughout 2025, the Qlik Academic Program has continued to empower students and educators worldwide by providing free access to our industry-leading data analytics tools. From Qlik Sense to advanced data visualization techniques, we’ve helped thousands of learners gain the skills they need to excel in a data-driven world. Our mission remains the same: to transform education by making analytics accessible, engaging, and practical.
This year, we’ve seen particularly exciting developments in Germany. We welcomed several new universities into the Qlik family, expanding our reach and helping even more students harness the power of data in their coursework. These new partnerships are just one example of how the program is making a difference, bringing data literacy to more classrooms and inspiring the next generation of data-savvy professionals.
For those who haven’t yet taken advantage of the Qlik Academic Program, now is the perfect time to start. The program offers a wealth of resources, qualifications, and free access to Qlik Sense—all designed to help you integrate powerful analytics into your teaching and learning. You can click here https://qlik.com/academicprogram to learn more about how to get started and join us on this exciting journey!
As we wrap up the year, I want to extend a heartfelt thank you to all our educators, students, and partners who have made 2025 such a memorable and impactful year. We’re proud of what we’ve accomplished together and excited for the new possibilities that 2026 will bring.
Stay tuned for more stories, more learning, and more opportunities as we continue to grow the Qlik Academic Program.
Here’s to a great year behind us and an even brighter one ahead!
-
【オンデマンド配信】The AI Reality Tour Tokyo 2025 ダイジェスト
去る 10月 28日(火)に開催しました「The AI Reality Tour Tokyo 2025」では、予測 AI・生成 AI・エージェンティック AI を統合した Qlik の最新製品をご紹介する基調講演をはじめ、Qlik のユーザーが語る先進的な事例、Qlik のパートナー企業による最新の... Show More去る 10月 28日(火)に開催しました「The AI Reality Tour Tokyo 2025」では、予測 AI・生成 AI・エージェンティック AI を統合した Qlik の最新製品をご紹介する基調講演をはじめ、Qlik のユーザーが語る先進的な事例、Qlik のパートナー企業による最新のテクノロジーやソリューション、展示ブースなどで、貴社の AI 戦略を成功に導く最新情報をご紹介しました。
当日の講演の一部をオンデマンドでご視聴いただけます。さらに、オンデマンド配信限定のテクノロジー講演も配信中!ぜひ、この機会にご視聴ください。
※本 Web セミナーは、2025年 10月 28日(火)開催の「The AI Reality Tour Tokyo 2025」 における一部の講演を録画したものです。
※視聴無料。パソコン・タブレット・スマートフォンで、どこからでもご視聴いただけます。
今すぐ視聴する -
Wrapping Up the Semester & Looking Ahead With Qlik
As the fall semester comes to a close, now is the perfect time to pause, enjoy family and friends, and fully embrace the holiday season. Take the time... Show MoreAs the fall semester comes to a close, now is the perfect time to pause, enjoy family and friends, and fully embrace the holiday season. Take the time to relax, regroup, and recharge—you’ve earned it.
When you return refreshed for a new year and a new semester, Qlik has you covered. We’re here to support you with everything you need to bring data analytics to life in your classroom.
For Professors: We Make Next Semester Easy
We provide ready-to-use academic resources, including:
-
Course content
-
Training materials
-
Syllabi
-
Exams
-
Hands-on learning tools
And the best part? You’re not doing it alone.
What I Can Offer You
I’m available to Zoom into your class to introduce Qlik, explain who we are, and walk through the opportunities available through our academic program.
Once your students are signed up, we offer a student workshop designed to build confidence with Qlik from day one. We cover the fundamentals so that when you begin your lessons, students already feel comfortable navigating and using the platform.
Let’s Get You on the Schedule
We’d love to partner with you next semester—and spots will fill up quickly.
Please reach out to me directly to reserve your session or ask any questions.
brittany.fournier@qlik.comDuring the Break
Make sure to get signed up and spend a little time exploring the Qlik portal. It’s a great chance to see all the tools and resources we have to offer! Sign up here!Enjoy the holidays, rest well, and we look forward to supporting you and your students in the new year!
-
-
Update to the Automations Custom Code block version beginning January 31st 2026
We plan to update the Custom Code block in Qlik Automate to upgrade related software versions. When will this change go into effect? The update is exp... Show MoreWe plan to update the Custom Code block in Qlik Automate to upgrade related software versions.
When will this change go into effect?
The update is expected to begin rolling out on January 31st, 2026. We urge developers and automation users to review their Custom Code blocks for any possible compatibility issues before this date and to update them where necessary.
What exactly is changed?
The following software versions will be updated:
- PHP 8.3.20 upgraded to PHP 8.4 (Visit PHP docs)
- NodeJS 22 upgraded to NodeJS 24 (Visit NodeJS docs)
- Python 3.12 upgraded to Python 3.14 (Visit Python docs)
If you have any questions, we're happy to assist. Reply to this blog post or take similar queries to the Qlik Automate forum.
Thank you for choosing Qlik,
Qlik Support -
Qlik Open Lakehouse、ストリーミング対応、信頼性、オープン性、AI対応を強化(Qlik Blog 翻訳)
本ブログは "Supercharging Qlik Open Lakehouse: Now Streaming, Trusted, Open, and AI-Ready" の翻訳です。 著者:Vijay Raja 本年の AWS re:Invent 2025 において、Qlik Open Lake... Show More本ブログは "Supercharging Qlik Open Lakehouse: Now Streaming, Trusted, Open, and AI-Ready" の翻訳です。
著者:Vijay Raja
本年の AWS re:Invent 2025 において、Qlik Open Lakehouse の次世代機能を発表できたことを大変嬉しく思います。これは大きな飛躍であり、リアルタイムストリーミング取り込み、オンザフライ変換、組み込みのデータ品質とガバナンス、拡張されたエコシステム統合など、待望の機能を実現します。
このリリースにより、Qlik Open Lakehouse は AI、分析、オペレーショナルインテリジェンスのための完全な基盤へと進化します。これまでにない形で、オープン性、パフォーマンス、信頼性を統合します。
ストリーミング取り込み:リアルタイムデータを Iceberg に直接投入
AI 主導の現代において、リアルタイムデータはもはやオプションではなく、基盤となる要素です。
Qlik Open Lakehouse では、データベース、SaaS アプリケーション、SAP、メインフレームなど数百のソースからリアルタイム CDC データとバッチデータを、わずか数クリックで Iceberg テーブルに直接取り込むことが既に可能です。
この度、Apache Iceberg 向け高スループットストリーミング取り込み機能を発表します。これにより組織は、Apache Kafka、Amazon Kinesis、Amazon S3 などのストリーミングソースから毎秒数百万件のイベントを、データウェアハウスを介さずに Qlik Open Lakehouse 経由で直接 Iceberg テーブルに取り込めます。
これにより、Web およびモバイルアプリ、IoT デバイス、ログなどからペタバイト規模のリアルタイムデータを継続的に収集・クエリできるようになり、サイバーセキュリティ分析、IoT監視、予知保全、ライブ AI モデルトレーニングなどのユースケースを実現します。これらすべてを、オープンで柔軟性が高く相互運用可能なプラットフォームで実現します。
また、Qlik Open Lakehouse は設計上、コスト効率にも優れています。自動修復機能を備えたコスト効率の高い Amazon EC2 スポットインスタンスを活用し、取り込みコストを最大 70~90% 削減します。これにより数百万ドル規模のコスト削減が可能です。Qlik Open Lakehouse の取り込みコストとパフォーマンスを比較した最新ベンチマークをご覧ください。
さらに重要なのは、Qlik Open Lakehouse がスキーマの自動進化、ファイルの最適化、障害からの自動復旧を実行するため、ユーザーが手動で対応する必要がない点です。ネストされたスキーマを含む進化するスキーマに自動的に適応し、リアルタイムイベントの一貫性と信頼性の高い処理を保証します。
Amazon Kinesis から Iceberg へのストリーミング取り込みを実演する最新デモを、ここで一部ご紹介します。
https://videos.qlik.com/watch/G2MpJC2Bp3ZZXWivJhHVkS?
ストリーミング変換:データが流れると同時に整形
リアルタイム取り込みは始まりに過ぎません。ストリーミング変換により、複雑な手動バッチジョブを待ったり、データウェアハウスにロードしたりすることなく、データがレイクハウスに流入する過程で、そのデータをクレンジング、結合、再整形できるようになりました。
視覚的でノーコードのインターフェースを通じて、データチームはクリーニング、フィルタリング、標準化、ネスト解除、フラット化、マスキングなどの変換を定義できます。これらすべてがストリーム内で適用され、スキーマの進化は自動的に処理されます。
結果として、数時間や数日ではなく、数分で AI や分析に即対応可能なデータが得られます。
これにより、チームはデータ品質や鮮度の問題を、ソースに近い場所でリアルタイムに解決し、エンドユーザーに影響を与えることなく、データをキュレーション・整形できます。
さらに、Qlik のコスト最適化コンピューティングエンジン(EC2 スポットインスタンスベース)により、自動スケーリング、フェイルオーバー、信頼性を備えながら、従来手法の3分の1のコストでリアルタイム変換を実現します。
相互運用性をめざした設計により Iceberg エコシステムを拡張
Qlik Open Lakehouse はオープン性を追求して構築されています。今回のリリースにより、その相互運用性をさらに拡大します。
オープンレイクハウスアーキテクチャをさらに強力にする3つの主要なエコシステム統合をご紹介します。
- Snowflake Open Catalog のサポート – 現在利用可能な AWS Glue Catalog に加えSnowflake Open Catalog のサポートを追加します。これにより、お客様は Iceberg カタログの選択肢が広がり、環境をまたいだシームレスなデータ発見とガバナンスが可能になります。この統合により、拡大を続ける Iceberg エコシステムとの相互運用性が大幅に強化され、お客様は AWS ネイティブサービスか Snowflake のクラウドネイティブ環境のいずれにいても、モダンなレイクハウスを構築する自由を得られます。
- Databricks と Amazon Redshift へのゼロコピーミラーリング – Qlik は既に Snowflake へのゼロコピーミラーリングを実現しており、ユーザーはデータを複製することなく Snowflake で外部テーブルを作成し、クエリやダウンストリーム変換を実行できます。これによりパフォーマンスを維持しつつコストを削減します。今回、この強力な機能を Databricks および Amazon Redshift へのミラーリングにも拡大しました。これにより、チームは複数のプラットフォームにまたがる Iceberg データのクエリや変換を、データの複製やコスト増なしに実行できます。
- Apache Spark 統合の強化 – Apache Spark のサポートを強化し、あらゆる Spark ベースのエンジンが最新の Iceberg データに直接アクセスできるようにします。これにより、大規模な分析、AI、機械学習ワークロードを実現します。
これらの統合により、真にオープンで柔軟なマルチエンジン対応のレイクハウス環境を提供します。データチームはサイロ化を解消し、データの重複を最小限に抑え、インサイト獲得までの時間を短縮できます。
エンドツーエンドのデータ品質とガバナンス
オープンであることと、無秩序であることは同義語ではありません。Qlik Open Lakehouse により、Qlik Talend の信頼性の高いデータ品質とガバナンス機能を、Open Lakehouse および Iceberg 環境に直接統合します。
エンドツーエンドのデータリネージ、検証ルール、セマンティックタイプ、Qlik Trust Score といった Qlik の主要機能が利用可能となり、オープンレイクハウス内の全データセットの正確性、追跡可能性、AI 対応性を保証します。ユーザーは Iceberg テーブルやミラーリングされた Snowflake 環境を横断するデータの流れと変換を監視でき、データパイプラインに対する完全な可視性と信頼性を獲得できます。
大規模環境(Qlik の管理されたレイクハウス環境、データウェアハウス内部)においても、データ品質検証ルールは柔軟に実行可能で、最も重要な箇所で確実な保証を提供します。セマンティックタイプは多様なデータセット間で一貫した意味と文脈を確立し、企業全体での情報解釈方法を標準化します。
さらに Qlik Trust Score および Qlik Trust Score for AI により、Iceberg テーブル内のデータであっても、分析や機械学習に向けたデータ準備度の定量化が可能です。これにより、アクションの根拠となるインサイトの信頼性を確実に保証します。
Qlik Open Lakehouse は、開放性とガバナンスを両立と、信頼できるデータに基づいた革新の実現を可能にします。
Qlik Open Lakehouse の新たなベンチマーク
もちろん、これらが顧客にとって真のコスト削減と有意義なビジネス成果につながらなければ意味がありません。
これを検証するため、当社はベンチマーク調査を実施し、実際の顧客シナリオをシミュレートしながら、Qlik Open Lakehouse とクラウドデータウェアハウスのデータ取り込みコストとパフォーマンスを比較しました。
Qlik Open Lakehouse と Iceberg の組み合わせは、データウェアハウス管理の Iceberg ソリューションや同等の構成のネイティブデータウェアハウスと比較して、約77~89%のコスト削減とコンピューティング消費量削減を実現し、データ鮮度を2.5~5倍向上させることで、顧客に桁違いの価値を提供しました。ベンチマークテストの詳細と結果は Benchmarking Ingestion Costs and Performance of Qlik Open Lakehouse Vs a Data Warehouse でご確認いただけます。
なぜこれが重要なのか
現代の企業は、柔軟でオープンなアーキテクチャを活用し、AI とリアルタイムインサイトを実現する基盤を構築しています。しかし、その実現にはデータパイプライン、データ品質、ガバナンス、コスト効率の再考が不可欠です。
Qlik Open Lakehouse は、統一されたオープンかつガバナンスされた基盤を提供し、以下の機能を実現します。
- リアルタイムのデータのストリーム処理、変換、最適化
- AWS、Snowflake、Databricks などエコシステム間のシームレスな相互運用性
- データ取り込みのためのインフラストラクチャおよびコンピューティングコストを最大70~90% 削減
- 統制され信頼性が高い、分析のためのデータを大規模に提供
これが AI とデータ分析の未来のために構築されたオープンレイクハウスの次の進化形です。Qlik Open Lakehouse は、常にアクセス可能で相互運用性が高く、ロックインも妥協もない将来に備えたデータ環境を提供します。
一度構築すればどこでも活用可能——それがオープンレイクハウスアーキテクチャの真価です。
はじめましょう
Qlik Open Lakehouse は既に一般提供されています。この度、発表した主要な新機能は 2026年第1四半期に一般提供を開始し、拡張機能は 2026年前半にかけて順次提供されます。
Qlik が現代の企業向けに、オープンでリアルタイムかつ信頼性の高いデータで可能性を再定義する方法について詳しくご覧ください。
-
Introducing: Write Table now available in Qlik Cloud Analytics
Make your analytics apps interactive. Edit data, add comments, and watch your updates sync across sessions instantly. With Write Table’s instant sync... Show MoreMake your analytics apps interactive.
Edit data, add comments, and watch your updates sync across sessions instantly. With Write Table’s instant syncing and change tracking, teams can collaborate in real time and export updates through Qlik Automate.
Find it in the Chart Library when editing an app and get started!
Learn more here:
- Write Table | help.qlik.com
- Qlik Write Table FAQ
- SaaS in 60
- Write Table Product Tour
- Write Table now available in Qlik Cloud Analytics | Qlik Product Innovation Blog
Thank you for choosing Qlik,
Qlik Support -
ダッシュボード上で直接入力・編集が可能に! Qlik Cloud の新機能 「ライトテーブル」
従来のBIツールでは、ダッシュボードで分析した内容を踏まえ次のアクションを取るために他システムへ入力したり、Excelでデータを修正して再度取り込み、また確認するといった作業が必要でした。分析画面と日常業務がつながっていないと、気付きを反映するまでに時間がかかったり、担当者間で認識がずれたりするケ... Show More従来のBIツールでは、ダッシュボードで分析した内容を踏まえ次のアクションを取るために他システムへ入力したり、Excelでデータを修正して再度取り込み、また確認するといった作業が必要でした。分析画面と日常業務がつながっていないと、気付きを反映するまでに時間がかかったり、担当者間で認識がずれたりするケースも少なくありません。
こうした課題に応える新機能として、Qlik Cloudに「Write table(ライトテーブル)」が追加されました。これは分析画面上に配置できる編集可能なテーブルで、ユーザーが直接セルに入力したり、プルダウンを使って更新することができます。複数人による同時編集にも対応しており、行単位でロックされるため競合が起きません。編集内容は“change store”に保存され、APIを使って外部システムとの連携や自動化フローのトリガーとして利用することも可能です。
この機能がもたらす価値は、「分析」と「実務」がこれまで以上に近づく点にあります。例えば在庫数の修正、配送ステータスの更新、営業案件の進捗管理、社内コメントの書き込みなど、従来であれば別システムで行っていた作業を、Qlikアプリ内で完結できるようになります。特にビジネス部門において、現場が気付いた内容をその場で即時反映できることは大きな強みです。
さらに、外部システム連携や自動化機能(Qlik Automate)を組み合わせれば、入力内容をもとに通知や外部システム更新を自動化するなど、「分析 → 編集 → 実行」を継ぎ目なく実現できます。BIを見るためのツールから意思決定と実行を支えるプラットフォームへ進化させたい企業にとって、Write tableは大きな一歩となるでしょう。
データ修正の二度手間を減らし、ダッシュボードと現場作業を自然につなぐ体験が、業務プロセスの質を大きく変えるはずです。ぜひ一度試してみてください。
Write tableは、Qlik Cloud Analytics Premium以上のサブスクリプション、または Qlik Sense Enterprise SaaS でご利用いただけます。
Qlik TECH TALK セミナー:分析アプリでの直接データ操作とリアルタイム情報共有を実現!Write Tableのご紹介

-
【オンデマンド配信】製造業向け自社製品の製品価値を最大化する!
製造業における競争力は、いま“データを活かせる製品”かどうかで大きく変わりつつあります。本 Web セミナーでは、自社製品に Qlik Cloud Analytics をバンドルすることで実現できる新たな価値創出モデルをご紹介します。センサーデータや稼働ログを可視化し、予兆保全やリモート診断を可能に... Show More製造業における競争力は、いま“データを活かせる製品”かどうかで大きく変わりつつあります。本 Web セミナーでは、自社製品に Qlik Cloud Analytics をバンドルすることで実現できる新たな価値創出モデルをご紹介します。センサーデータや稼働ログを可視化し、予兆保全やリモート診断を可能にするだけでなく、製品改善につながる利用データの取得、アフターサービスの収益化など、多くのメリットを具体的なユースケースを交えて解説します。“売り切り”から“継続的な価値提供”へ。製品の競争力を高め、顧客満足度を向上させるための実践的な方法をぜひご確認ください。
※ パソコン・タブレット・スマートフォンで、どこからでもご視聴いただけます。
今すぐ視聴する -
Qlik Trail: an extension to record, replay, and share your selection journeys
When I’m exploring a Qlik app, I often want to show exactly how I reached a view—without typing instructions or jumping on a call. Qlik Trail is a sma... Show MoreWhen I’m exploring a Qlik app, I often want to show exactly how I reached a view—without typing instructions or jumping on a call.
Qlik Trail is a small extension I created that does just that: Click Record, make your selections, and you’ll get a tidy list of steps that you can replay from start to finish, or jump to a specific step. Then, when you’re happy with the journey, you can export the trail as JSON and hand it to someone else so they can import and run the same sequence on their side.
Why not just use bookmarks?
Bookmarks are great for destinations (one final selection state). Qlik Trail is more about the path:
-
Multiple steps in a defined order (A → B → C)
-
Replay from start for narration or Replay a specific step
-
Export/import a whole journey, not a bunch of one-offs
You can use bookmarks to save a point in time, and use Qlik Trail when the sequence matters more.
What can you do with the Qlik Trail extension?
-
Record steps manually, or toggle Auto to capture each change
-
Name, duplicate, reorder, delete, or ungroup steps
-
Organize steps into Groups (Executive Story, Sales Ops, Training, …)
-
Replay to here (apply one step) or Replay from start (play the group)
-
Export / Import trails as JSON
Demo
Before we go into how the extension was built, let's see a demo of how it can be used.
I’ll share two practical trails an Executive Story and Sales Ops with selections you can record and replay on your end, for this demo I'll use the Consumer Goods Sales app (which you can get here: https://explore.qlik.com/details/consumer-goods-sales)
Setup
-
Upload the extension .zip file in the Management Console, then add Qlik Trail (custom object) to a sheet.
-
Optional: enable Auto-record in the object’s properties if you want every change captured while you explore.
-
Toolbar (left to right): Record, Replay from start, Delete, Delete all, Auto, Group filter, New group, Export, Import.
Trail 1 — Executive Story
Create Group: Executive Story
Step 0 — “US overview: top categories”
Selections: (none)Step 1 — “Northeast · Fresh Vegetables”
Selections: Region = Northeast, Product Group = Fresh VegetablesStep 2 — “Northeast · Cheese (A/B)”
Selections: Region = Northeast, Product Group = Cheese
quick A/B inside the same region.Step 3 — “West vs Northeast · Fresh Fruit”
Selections: Region = West, Northeast, Product Group = Fresh Fruit
same category across two regions to see differences.Step 4 — “Northeast focus: PA · Fresh Fruit”
Selections: Region = Northeast, State = Pennsylvania, Product Group = Fresh Fruit
drill to a particular state.Presenting: select the group → Replay from start. If questions land on Step 4, use Replay to here.
Trail 2 — Sales Ops Story
Create Group: Sales Ops Story
Step 1 — “South · Ice Cream & Juice (summer basket)”
Selections: Region = South, Product Group = Ice Cream, JuiceStep 2 — “Central · Hot Dogs (promo check-in)”
Selections: Region = Central, Product Group = Hot DogsStep 3 — “West · Cheese (margin look)”
Selections: Region = West, Product Group = CheeseTips when building trails
-
One idea per step. (Region + Category) or (Region + a couple of States)
-
Duplicate then tweak for fast A/B comparisons
-
Group by audience. Exec, Ops, Training
-
Ungrouped steps = scratchpad. Move into a group when it’s ready
-
After recording, drag to reorder so replay tells a clean story
Sharing your trails
Click Export to download qliktrail_export_YYYY-MM-DD_HHMM.json.
Your teammate can Import, pick a group, and hit Replay from start. Same steps, same order—no instructions needed.
Tech notes
1) Module & CSS injection
Load CSS once at runtime so the object stays self-contained:define(['qlik','jquery','./properties','text!./style.css'], function(qlik, $, props, css){ if (!document.getElementById('qliktrail-style')) { const st = document.createElement('style'); st.id = 'qliktrail-style'; st.textContent = css; document.head.appendChild(st); } // … });2) Capturing selections per state
Read SelectionObject, group by qStateName, then fetch only selected rows via a lightweight list object. Store both text and numeric to be resilient to numeric fields:app.getList('SelectionObject', function(m){ // build grouped { state -> [fields] } }); ... app.createList({ qStateName: stateName || '$', qDef: { qFieldDefs: [fieldName] }, qInitialDataFetch: [{ qTop:0, qLeft:0, qWidth:1, qHeight:10000 }] }).then(obj => obj.getLayout() /* collect S/L/XS states */);Snapshot (what we export/import):
{
  "ts": "2025-03-10T14:30:00Z",
  "states": [
    {
      "state": "$",
      "fields": {
        "Region": { "text": ["Northeast"], "num": [] },
        "Product Group": { "text": ["Fresh Vegetables"], "num": [] }
      }
    }
  ]
}
3) Replaying selections
Clear target state, then select values. Prefer numbers when available; fall back to text:app.clearAll(false, state);
... field.selectValues(pack.num.map(n=>({qNumber:n})), false, false) // fallback to qText field.selectValues(pack.text.map(t=>({qText:String(t)})), false, false);4) Auto-record with a quiet window
Avoid recording during replays to prevent ghost steps:ui.replayQuietUntil = Date.now() + (layout.props.replayQuietMs || 1200); if (Date.now() >= ui.replayQuietUntil && ui.autoOn) record();5) Groups, ordering & persistence
Trails live in localStorage per app key. Groups look like { id, name, members:[stepId,…] }. Ordering is a simple seq integer; drag-and-drop reassigns seq inside the open list.That’s Qlik Trail in a nutshell. It lets you hit record, name a few steps, and replay the story without hand-holding anyone through filters. Use Bookmarks to keep states, but Trail will help you keep tack of the sequence.
P.S: this extension is a work-in-progress experiment and not prod-ready, I'm planning to add more features to it and make it more stable in the future.
🖇 Link to download the extension: https://github.com/olim-dev/qlik-trail -
-
Qlik Cloud Analytics Enhancements
As we enter the last month of the year, let’s review some recent enhancements in Qlik Cloud Analytics visualizations and apps. On a continuous cycle, ... Show MoreAs we enter the last month of the year, let’s review some recent enhancements in Qlik Cloud Analytics visualizations and apps. On a continuous cycle, features are being added to improve usability, development and appearance. Let’s’ look at a few of them.
Straight Table
Let’s begin with the straight table. Now, when you create a straight table in an app, you will have access to column header actions, enabled by default. Users can quickly sort any field by clicking on the column header. The sort order (ascending or descending) will be indicated by the arrow. Users can also perform a search in a column by clicking the magnifying glass.
When the magnifying glass icon is clicked, the search menu is displayed as seen below.
If a cyclic dimension is being used in the straight table, users can cycle through the dimensions using the cyclic icon that is now visible in the column heading (see below).
When you have an existing straight table in an app, these new features will not be visible by default but can easily be enabled in the properties panel by going to Presentation > Accessibility and unchecking Increase accessibility.
Bar Chart
The bar chart now has a new feature that allows the developer to set a custom width of the bar when in continuous mode. Just last week, I put the bar chart below in continuous mode and the bars became very thin as seen below.
But now, there is this period drop down that allows developers to indicate the unit of the data values.
If I select Auto to automatically detect the period, the chart looks so much better.
Combo Chart
In a combo chart, a line can now be styled using area versus just a line, as displayed below.
Sheet Thumbnails
One of the coolest enhancements is the ability to auto-generate sheet thumbnails. What a time saver. From the sheet properties, simply click on the Generate thumbnail icon and the thumbnail will be automatically created. No more creating the sheet thumbnails manually by taking screenshots and uploading them and assigning them to the appropriate sheet. If you would like to use another image, that option is still available in the sheet properties.
From this
To this in one click
Try out these new enhancements to make development and analysis faster and more efficient.
Thanks,
Jennell
-
Qlik Cloud 11月の新機能
分析の新機能 コンボ チャートにおける線のエリア コンボチャートで線を使用する場合に、エリアを表示できるようになりました。これにより、単にトレンドを示すだけでなく、データの大きさを表現しやすくなります。 連続軸の棒グラフの幅のカスタマイズ 連続スケール(Continuous Axis)を使用す... Show More分析の新機能
コンボ チャートにおける線のエリア
コンボチャートで線を使用する場合に、エリアを表示できるようになりました。これにより、単にトレンドを示すだけでなく、データの大きさを表現しやすくなります。
連続軸の棒グラフの幅のカスタマイズ
連続スケール(Continuous Axis)を使用する棒グラフにおいて、棒の幅(太さ)をデータ単位に基づいて自由に設定できるようになり、視認性が大幅に改善されました。
シートサムネイルの自動生成機能
シートの内容を反映したサムネイル画像が自動生成されるようになり、手動設定なしで視覚的な判別が容易になりました。デフォルトの骨組み(スケルトン)アイコンの代わりに、実際のシート内容を反映したプレビューが表示されるため、中身が一目で分かります。手動でスクリーンショットを撮ってアップロードする作業が不要になります。視覚的なプレビューにより、目的のシートを素早く直感的に見つけることができます。
Table Recipeの機能強化
Table RecipeのフィルタリングとNull処理が強化され、さらに作成したレシピをData Flowへシームレスに変換できるようになり、拡張性が大幅に向上しました。
- フィルタリングの柔軟性: 複数の条件に対して「すべて(All) / いずれか(Any) / なし(None)」のロジックを適用可能になり、値のサジェスト機能も強化されました。
- Null/空文字の厳密化: Nullと空文字(Empty)を明確に区別し、それぞれの状況に応じた適切な処理(削除や埋め込み)を提案します。
- Data Flowへの昇格: Table RecipeからData Flowへワンクリックで変換・複製が可能になり、より高度なデータ処理パイプラインへの拡張が容易になりました。
データフロー:トラブルシューティングと生産性向上機能
データフローのUI/UXが強化され、エラー箇所の即時特定やショートカット操作が可能になり、開発・修正作業の効率が大幅に向上しました。
Qlik Automate のアップデート
- Qlik Automate コネクタが更新され、リロード処理のエラーハンドリングと帳票テンプレートAPIへのアクセスが可能になりました。
- Outlookコネクタを通じて、添付ファイル付きのメールを送信できるようになりました。Microsoft は 2026 年 3 月 1 日に Outlook の SMTP 認証を廃止する予定です。すべての Microsoft ユーザーは、この更新を適用して準備することを強くお勧めします。
- Qlik Reportingコネクタが拡張され、HTML形式でのレポート生成が可能になりました。これにより、レポートをファイルとして配布するだけでなく、メール本文への埋め込みなども容易になりました。
Qlik Analytics Migration Tool: 2025年11月リリース
- 安定性の強化: 主にバグ修正と安定性の改善に重点を置いたアップデートです。
- Qlik Cloud Governmentでも利用可能となりました。
- パフォーマンス向上: 移行プロセスの中核となるワークフローの処理性能が改善されました。
- 詳細情報: 具体的な修正内容を含む完全なリリースノートはQlik Communityで公開されています。
データ統合の新機能
新しい SQL 変換 UI
SQL開発者の生産性を最大化するため、エディタインターフェースが全面的に刷新され、コーディングからテスト実行までの操作性が大幅に向上しました。
- エディタの現代化: 作業領域の拡大、複数クエリの記述・選択実行、およびショートカットキー(実行、コメント、検索置換など)に対応しました。
- データセット支援: データセットの履歴バリアント表示、SELECT文の自動生成、およびパラメータの自動割り当て機能が追加されました。
- 実行可視性: 直近に実行したクエリの内容と、その完了にかかった所要時間を即座に確認できるようになりました。
Databricks でナレッジ マートのサポートを開始
ナレッジ マートタスクが Databricks Vector Store と Databricks LLMs をサポートし、エンドツーエンドの AI データパイプラインを Databricks 環境内で完結できるようになりました。
- Databricks対応: ベクトル格納先(Vector Store)および埋め込み用LLMとして、新たにDatabricksをサポートしました。
- RAG構築の自動化: 構造化・非構造化データの変換、ベクトル化、ロードまでの一連のプロセスを自動化します。
- エコシステムの拡張: 従来のSnowflakeに加え、ElasticSearch、OpenSearch、PineCone、OpenAI、Bedrockなど多様なAI基盤と連携可能です。
Pipelines のバージョン管理からプロジェクトのインポート
Qlik Talend Cloud上で、バージョン管理システムから直接プロジェクトのブランチをインポートすることが可能になりました。他の開発者のコードをレビューしたり、共同で作業を進める際の手間を削減し、開発(Dev)、品質検証(QA)、本番(Prod)といった異なるスペースやテナント間で、プロジェクトを安全に共有・移行することができます。
その他
管理者向けの新機能
同時自動化実行の導入
同じ自動化の実行を、複数同時に開始できるようになりました。各自動化の設定、およびアクティビティ センターの自動化セクションでグローバルに設定が可能です。デフォルトは10の設定となっております。
Webhook セキュリティの強化
Webhook機能においてセキュリティが強化され、ヘッダー値の暗号化とシークレットの保護が可能になりました。
新しい Direct Access gateway バージョン (1.7.8)
Databricks接続におけるOAuth認証のサポート強化と、プロセス分離時のポート設定の柔軟性が向上しました。
RESTコネクタとファイルコネクタの許可リスト設定のサポート
管理画面から、Direct Access gateway経由のRESTおよびFileコネクタに対するアクセス許可リスト(Allow Lists)を直接設定できるようになりました。
Qlik Cloudがフランスに進出
フランスに新たなクラウドリージョンを提供開始しました。世界で13番目のリージョンとなります。
-
【オンデマンド配信】卸売業界必見!SAP データの利活用
多くの卸売企業が基幹システムとして利用している SAP。そこに格納されているデータを外部データなどと組み合わせてさまざまなビジネスシーンで広く活用することで、その価値は何倍にも高まります。一方で SAP データを簡単に解放することが難しいという現実もあります。本 Web セミナーでは、SAP データ... Show More -
Qlik Automate: 30-second interval deprecation January 12, 2026
Starting January 12, 2026, the 30-second interval option will no longer be available in the Qlik Automate scheduler. This update prepares Qlik Automa... Show MoreStarting January 12, 2026, the 30-second interval option will no longer be available in the Qlik Automate scheduler.
This update prepares Qlik Automate for a future upgrade that will bring enhanced scheduling capabilities that are consistent with other Qlik products, including:
- Support for specific days and dates
- Configurable time windows
How will this affect me?
All automations using the 30-second interval will continue to work and run on the 30-second interval for now.
At a yet to be decided date, automations that still use a 30-second interval will be migrated to a 1-minute interval. Subscribe to this blog post to stay informed.
What actions do I need to take?
Please review your automations that use 30-second intervals to ensure they will function properly with a 1-minute interval.
Don't hesitate to reach out if you have any questions or address our experts directly in the Qlik Automate forum.
Thank you for choosing Qlik,
Qlik Support -
Regular Expressions in Qlik: Finally Native
Regex has been one of the most requested features in Qlik Sense for years, and now it’s finally here. With this year's May 2025 release, Qlik added n... Show MoreRegex has been one of the most requested features in Qlik Sense for years, and now it’s finally here.
With this year's May 2025 release, Qlik added native support for regular expressions in both load scripts and chart expressions. That means you can validate formats, extract values, clean up messy text, and more, all without complex string logic or external preprocessing.
In this post, we’ll look at what’s new, how it compares to the old workarounds, and a practical example you can plug into your own app.
The New Regex Functions
Regex (short for Regular Expression) is a compact way to define text patterns. If you’ve used it in Python, JavaScript, or other programming languages, the concept will feel familiar.
Qlik now includes native support for regular expressions with functions that work in load scripts and chart expressions:
-
MatchRegEx() – check if a value matches a pattern
-
ExtractRegEx() – extract the first substring that matches
-
ReplaceRegEx() – search and replace based on a pattern
-
SubFieldRegEx() – split text using regex as the delimiter
There are also group-based versions (ExtractRegExGroup, etc.), case-insensitive variants (MatchRegExI), and helpers like CountRegEx() and IsRegEx().
Replacing Old Patterns
Here's where regex saves time:
- Format validation: Replace nested Len(), Left(), and Mid() with a single pattern.
- Substring extraction: Skip the manual slicing; let the pattern do the work.
-
Pattern-based replacements: Clean or reformat values without chaining multiple functions.
With regex:
If(MatchRegEx(Code, '^[A-Z]{2}-\d{5}$'), 'Valid', 'Invalid')  // check format

ExtractRegEx(Text, '\d{5}')                                   // get first 5-digit number

ReplaceRegEx(Field, '\D', '')                                 // strip non-digits
Cleaner logic. Fewer steps. Easier to maintain.
Use Cases That Just Got Easier
If any of the following sound familiar, regex will help:
-
Format checks: postal codes, product SKUs, ID numbers.
-
Data extraction: get domain from email, number from notes, etc.
-
PII masking: hide parts of a SSN or credit card.
-
String cleanup: strip unwanted characters, normalize spacing.
-
Splitting tricky fields: CSV lines with quoted commas, mixed delimiters.
Keep in mind that these functions can be used directly in chart expression, so you can build visuals or filters based on pattern logic, not just static values.
Example: Clean and Validate Phone NumbersLet’s say you’ve got a bunch of phone numbers like this:
(312) 678-4412
312-678-4412
3126784412
123-678-4412    // invalid: area code starts with 1
312-045-4412    // invalid: exchange starts with 0
312-678-441     // invalid: too short
You want to:
-
Validate that it’s a proper 10-digit North American number
-
Standardize the format to (###) ###-####
Here’s how to do it with regex in your load script:
LOAD
    RawPhone,

    // 1. Strip out anything that's not a digit
    ReplaceRegEx(RawPhone, '\D', '') as DigitsOnly,

    // 2. Validate: 10 digits exactly, starting with 2–9
    If(MatchRegEx(RawPhone, '^\(?[2-9]\d{2}\)?[-.\s]?\d{3}[-.\s]?\d{4}$'),
        'Valid', 'Invalid') as Status,

    // 3. Standardize format to (###) ###-####
    ReplaceRegEx(
        ReplaceRegEx(RawPhone, '\D', ''),
        '(\d{3})(\d{3})(\d{4})',
        '(\1) \2-\3'
    ) as FormattedPhone

INLINE [
    RawPhone
    3025557890
    (404) 222-8800
    678.333.1010
    213 888 9999
    1035559999
    678-00-0000
    55577
];
Result:
One pattern replaces multiple conditions and formatting is consistent. This is much easier to maintain and easy to expand if the rules change.
Final Thoughts- Use regex where it adds value.
For simple cases like Left() or Trim(), stick with built-in string functions. - When you're working with inconsistent inputs, embedded formats, or anything that doesn’t follow clean rules, regex can save a lot of time.
- If you're applying regex across large datasets, especially in charts, it’s better to handle it in the load script where possible.
Not sure how to write the pattern?
Tools like regex101.com or regexr.com are great for testing and adjusting before you build in Qlik.
With native regex in Qlik Sense, you can now clean, validate, extract, and transform text with precision without convoluted scripts or third-party tools. It’s a quiet but powerful upgrade that unlocks a ton of flexibility for real-world data.
-
-
Techspert Talks - Unleashing the Qlik Talend Cloud Dynamic Engine
Hi everyone, Want to stay a step ahead of important Qlik support issues? Then sign up for our monthly webinar series where you can get first-hand ins... Show MoreHi everyone,
Want to stay a step ahead of important Qlik support issues? Then sign up for our monthly webinar series where you can get first-hand insights from Qlik experts.The Techspert Talks session from December was Unleashing the Qlik Talend Cloud Dynamic Engine.
But wait, what is it exactly?
Techspert Talks is a free webinar held on a monthly basis, where you can hear directly from Qlik Techsperts on topics that are relevant to Customers and Partners today.In this session we will cover:
- Enabling seamless parity
- Scaling always-on deployment
- Expanding DevOps agility

-
Qlik Community Scavenger Hunt Now Live!
Hi Qlik Community, We’re kicking off December with something fun, interactive, and built to bring the entire Community together. The Qlik Community Sc... Show MoreHi Qlik Community,
We’re kicking off December with something fun, interactive, and built to bring the entire Community together. The Qlik Community Scavenger Hunt is officially live and will run from December 3–17.
This two-week experience is designed to help you explore new corners of the Community, learn about key resources, and test your eye for detail. Whether you’re a longtime contributor or brand new to Qlik, this is a great way to jump in!
How the Scavenger Hunt Works
We’ve published a dedicated post with everything you need to get started, including all the clues, instructions, and the form to submit your final answer. Each clue leads you to a specific forum or page across the Community where you’ll uncover one hidden letter. Collect all the letters, solve the final phrase, and submit your entry.
Everyone who completes the hunt will be entered into a raffle for a chance to win exclusive Qlik swag.
Holiday Snow on Homepage!
We’ve brought back the snow to the Community homepage. You can toggle the snow off or on through the snow button to the right of the homepage.
That’s all for now! We can’t wait to see how many of you complete the hunt. Good luck, and thank you for being part of the Qlik Community. We’ll be back soon with more updates.
Your Qlik Community Managers,
Sue, Jamie, Nicole, Caleb, and Brett@Sue_Macaluso @Jamie_Gregory @nicole_ulloa @Brett_Cunningham
-
Qlik Academic Program in Brazil
Education in Brazil is changing fast, and data skills are becoming more important every day,especially with the rise of AI. That’s why the Qlik Academ... Show MoreEducation in Brazil is changing fast, and data skills are becoming more important every day,especially with the rise of AI. That’s why the Qlik Academic Program is gaining so much attention across the country. More universities, teachers, and students are discovering how Qlik can help them learn and grow.
Teachers across Brazil are using Qlik to update their classes and give students a taste of what today’s job market looks like. Whether it’s a workshop, a guest lecture, professor training, a Qlik Sense demo, or a presentation about the Academic Program in São Paulo, Rio de Janeiro, Paraná, Florianópolis, Paraíba, and beyond, the Academic Program offers simple, collaborative, and flexible ways to learn about data.
Brazil has a strong culture of creativity and learning, which aligns perfectly with Qlik’s mission. The Academic Program gives students and teachers free access to high-quality learning materials. Students can explore data, practice real-world skills, and even earn recognized certificates. Teachers also receive ready-to-use resources that make it easy to bring Qlik into their lessons.
As the Qlik Academic Program continues to grow in Brazil, these collaborations represent something bigger than expansion. Whether you're studying in Porto Alegre, teaching in Recife, or researching in Manaus, the goal is the same: to help everyone learn and succeed.
If you want to learn more about how Qlik can support your studies or teaching, visit Qlik Academic Program: Creating a Data-Literate World


