Unlock a world of possibilities! Login now and discover the exclusive benefits awaiting you.
Data Integration & Quality
Forums for Qlik Data Integration solutions. Ask questions, join discussions, find solutions, and access documentation and resources
Explore Qlik Gallery
Qlik Gallery is meant to encourage Qlikkies everywhere to share their progress – from a first Qlik app – to a favorite Qlik app – and everything in-between.
About Qlik Community
Get started on Qlik Community, find How-To documents, and join general non-product related discussions.
Qlik Resources
Direct links to other resources within the Qlik ecosystem. We suggest you bookmark this page.
Qlik Academic Program
Qlik gives qualified university students, educators, and researchers free Qlik software and resources to prepare students for the data-driven workplace.
Recent Blog Posts
-
Do More with Qlik - Art of the Possible, Embedding Qlik, Capabilities Recap and ...
Video Resources mentioned in video: Do More Previous Webinars:https://www.youtube.com/playlist?list=PLW1uf5CQ_gSo8GzlcFKAjIxLfFETDECcK Do More Tips ... Show MoreVideo
Resources mentioned in video:
Do More Previous Webinars:
https://www.youtube.com/playlist?list=PLW1uf5CQ_gSo8GzlcFKAjIxLfFETDECcKDo More Tips and Tricks Edition
https://www.youtube.com/playlist?list=PLW1uf5CQ_gSqF5bcmbBrk1q7Q4-h899V1** Embedding using qlik-embed **
Discovering the new qlik-embed library:
https://community.qlik.com/t5/Design/Discovering-qlik-embed-Qlik-s-new-library-for-Embedding-Qlik/ba-p/2141202Silent Auth using qlik-embed:
https://community.qlik.com/t5/Design/Silent-Auth-using-qlik-embed-and-OAuth/ba-p/2451292** Embedding other Qlik APIs **
Insight Advisor API integration:
https://community.qlik.com/t5/Design/Using-Insight-Advisor-API-in-your-Web-App/ba-p/2420280AutoML Real-Time API integration:
https://community.qlik.com/t5/Design/Exploring-Qlik-AutoML-Real-time-Predictions-API/ba-p/2128483** Creating extensions & Embedding using Qlik’s other libraries: Enigma, Nebula, Picasso **
Enigma Basics:
Part 1: https://community.qlik.com/t5/Design/Interacting-with-data-using-Enigma-js-Hypercubes-and-List/ba-p/1970913Nebula & D3.js to build a custom extension: https://community.qlik.com/t5/Design/Using-Nebula-js-amp-D3-js-to-build-a-visualization-extension-for/ba-p/2050662
Nebula.js to build a custom extension: https://community.qlik.com/t5/Design/Using-Nebula-js-to-build-a-visualization-extension-for-Qlik/ba-p/2003140

-
Enhance your AI Skills with a Free Qlik Learning Live Webinar!
Imagine completely transforming the way you work with your data using the power of Artificial Intelligence (AI) in Qlik. Since 2018, we have been addi... Show MoreImagine completely transforming the way you work with your data using the power of Artificial Intelligence (AI) in Qlik. Since 2018, we have been adding features to help our users get the most value from their data.
After all these years, one thing is clear: this is just the beginning!
Don't want to fall behind but not sure where to start?
Join the Qlik Education Team for a special 90-minute webinar session on July 9th at 10:00 AM EST/4:00 PM CEST; that will provide a deep dive into the world of Artificial Intelligence and explore the Augmented Analytics Capabilities in Qlik Sense.
What You'll Learn in This 90-Minute Webinar:
- Fundamentals of Artificial Intelligence (AI): Understand the basics and different types of AI.
- Insight Advisor: Discover its conversational capabilities to enhance your application use.
- AutoML: Learn how it uses historical data to predict future outcomes through classification and regression algorithms.
- Qlik Cloud Analytics and Large Language Models (LLMs): See how Qlik can help you leverage their power.
We have prepared a wealth of valuable content for you, and we’re excited to help you elevate your data analysis skills to the next level.
REGISTER now to secure your spot as spaces are limited.
Don’t miss out on this FREE opportunity!
We look forward to seeing you there!
-
Celebrating Summer Solstice with Streamlined Scripting
As we embrace the longest day of the year, the summer solstice, I am reminded of the importance of making the most of every moment. While the sun shin... Show MoreAs we embrace the longest day of the year, the summer solstice, I am reminded of the importance of making the most of every moment. While the sun shines brightly, we want our dedicated Qlik developers, consultants, and "Qlik script rock-stars" to enjoy the weather rather than spend countless hours in the script editor interface. That’s why we are excited to introduce our latest improvements, designed to enhance your scripting experience and give you more time to bask in the summer glow.
Keep reading to explore the enhancements we've made to the script and data load editors, ensuring a more efficient, consistent, and enjoyable user experience. Whether you're tackling data prep or loading data into a Qlik Sense app, these updates will streamline your workflow and promote best practices, allowing you to spend less time on scripts and more time soaking up the sunshine.
Fixing pain points in autocomplete
Autocomplete has been a persistent issue for many of you, often causing more frustration than convenience. Recognizing this, we released an update on February 15th, to make autocomplete less aggressive in both script and expression editors. This seemingly small bug fix has had a significant impact, earning praise from our developer community.
A few days ago on June 18th, we released an enhancement that allows you to enable or disable autocomplete according to your preference. This flexibility addresses one of the biggest pain points raised by our script writers, empowering you to work more efficiently.
For more details, check out the community discussion by Partner Ambassador – Ometis.
Consistent user experience across script editors
We are committed to providing a consistent user experience across our platforms. In November 2023, we released a standalone script editor for data prep use cases. This year, we’ve ensured that the functionality in the standalone script editor is mirrored in the Data Load Editor used by over 11k users for loading data into Qlik Sense apps.
Promoting good practices with reusable and modular code
We’ve also made strides in promoting good coding practices. We introduced QVS file support, allowing you to upload, preview, and include QVS files in your scripts. This feature, released on April 31st in the script editor and on May 21st in the Data Load Editor, supports the reuse of script parts and encourages modularity.
Stay tuned for future updates… because we are planning to take the current functionality of read only to the next level and include editable scripts within Qlik Cloud!
This enhancement not only promotes best practices but also helps with a smoother transition to Qlik Cloud for those heavily utilizing QVS files in client-managed deployments.
Explore community feedback:
Enhanced Data Load EditorThe Enhanced Data Load Editor, released on May 21st, brings a host of new functionalities aimed at improving usability. These include the ability to preview loaded data directly from the editor, the introduction of a STORE command wizard, and resizable panels. With these improvements the script coding experience is more intuitive and efficient, aligning it with the capabilities of the enhanced script editor in Qlik Cloud.
Key features include:
- Data preview with limited loading and table/profile previews for troubleshooting during development without switching between app sheets or data model viewer, allowing quick checks on script effects on a limited number of rows.
- Resizable panels for a customizable workspace
Note: These enhancements were previously introduced in the standalone script editor in November 2023 for data prep use cases. If you missed that update, catch up here:
Community reactions
The release of these improvements in the Data Load Editor has inspired positive reactions across the Qlik community. Here’s what some of our Partner Ambassadors and consultants had to say:
- Partner Ambassador Alex Walker - Ometis
- Partner Ambassador Cristof Schwarz - Databridge
- Consultant Paul Verkooijen - BZTRS Agency
Embracing a 'Cloud-First' approach
While we emphasize a cloud-first strategy, we understand the importance of supporting both cloud and client-managed environments. The standalone script editor and script object improvements are currently supported in Qlik Cloud. However, enhancements to the Data Load Editor and expression editor are also included in Qlik Sense client-managed, with major updates planned for the November 2024 release.
These updates, including enhanced Data Load Editor features and QVS file support, not only improve the current experience but also encourage a gradual move to Qlik Cloud.
Looking forward
As we continue to innovate and improve the Qlik scripting experience, your feedback remains invaluable. Be on the lookout for more updates, and let’s make the most of these long summer days together!
To learn more:
- What’s New in Qlik Cloud | Qlik Help
- Creating reusable load script with QVS files | Qlik Help
- Scripting to load or export data | Qlik Help
-
More on qlik-embed: Charts on the Fly and OAuth Impersonation
In the last couple of posts, we explored qlik-embed, Qlik’s new library for embedding Qlik Sense analytics into web applications, and went over how to... Show MoreIn the last couple of posts, we explored qlik-embed, Qlik’s new library for embedding Qlik Sense analytics into web applications, and went over how to do silent authentication with OAuth. Since then, the library has seen some updates, and today, we’ll delve into a new feature that allows to embed charts that are created on the fly as well as look into how to handle anonymous access using OAuth impersonation.
-
What’s New in qlik-embed?
Charts on the Fly
One of the features that standout in the newest qlik-embed release is "charts on the fly." This allows you to create charts dynamically from data within a Qlik Sense app without needing the chart to pre-exist in the app itself.
Instead, you pass a chart definition including dimensions, measures, and chart properties, and qlik-embed generates it on the fly in your web app.
Here’s a quick example using qlik-embed web components:
<!DOCTYPE html>
<html lang="en">

<head>
    <meta charset="UTF-8" />
    <meta name="viewport" content="width=device-width, initial-scale=1.0" />
    <meta http-equiv="X-UA-Compatible" content="ie=edge" />
    <style>
        .container {
            padding: 8px;
            gap: 8px;
            position: relative;
            flex: 1 0 auto;
            display: flex;
            flex-direction: column;
            align-items: stretch;
            box-sizing: border-box;
        }

        .viz {
            width: 600px;
            height: 600px;
            padding: 16px;
            border: 1px solid #bbb;
            border-radius: 3px;
            box-shadow: 1px 1px 10px rgba(0, 0, 0, 0.2);
            position: relative;
        }
    </style>
    <title>@qlik/embed-web-components example - using OAuth</title>
    <script crossorigin="anonymous" type="application/javascript"
        src="https://cdn.jsdelivr.net/npm/@qlik/embed-web-components@1/dist/index.min.js"
        data-host="<YOUR TENANT>" data-client-id="<CLIENT ID>"
        data-redirect-uri="https://localhost:3000/index_oauth_object.html" data-access-token-storage="session"></script>
</head>

<body>
    <div id="main-app">
        <div class="container">
            <h1>@qlik/embed-web-components Example</h1>
        </div>
        <div id="analytics-chart" class="container">
            <h2>"qlik-embed" <em>analytics-chart</em> embedding chart on the fly.</h2>
            <div class="viz">
                <qlik-embed id="visualization" ui="analytics/chart" app-id="<THE APP ID>"
                    type="barchart" dimensions='["Type", "Experience"]' measures='["Count([Demo ID])"]'
                    properties='{ orientation: "horizontal", barGrouping: { grouping: "stacked" } }'
                    context___json='{ theme: "Breeze", interactions: { select: false } }'></qlik-embed>

            </div>
        </div>
</body>

</html>
This feature is particularly powerful for creating highly dynamic and responsive dashboards where the visualizations can adapt to the user's needs in real time. However, keep in mind that "charts on the fly" is currently limited to the chart types available in the analytics/chart UI within qlik-embed. You can refer to the chart compatibility table for the most up-to-date information.
Notice that you can now pass context using the context___json (triple underscores (
___)) to apply a specific theme etc..For instance:
<qlik-embed context___json='{ theme: "Breeze" }' ... />-
Understanding OAuth Impersonation
OAuth impersonation tokens in Qlik Cloud are a game-changer for web applications needing to access resources on behalf of users, especially when dealing with different identity providers. This method replaces the need for third-party cookies with OAuth tokens to maintain state, significantly improving security and user experience.
Things to keep in mind when using OAuth Impersonation:
- Do Not Expose Machine-to-Machine Clients on the Frontend: keep your client secrets in the backend.
- Use a Backend Web Application for Token Issuance: Create an endpoint in your backend application to issue tokens.
- Explicitly Set Scopes on Impersonation Tokens: Ensure your tokens have the minimal required scopes to enhance security.
Here’s an example snippet for issuing impersonation tokens using the @qlik/api library:
import { auth as qlikAuth, users as qlikUsers } from "@qlik/api";

const qlikConfig = {
  authType: "oauth2",
  host: "https://tenantName.region.qlikcloud.com",
  clientId: "OAuth impersonation client Id",
  clientSecret: "OAuth impersonation client secret",
};

//set the host configuration to talk to Qlik tenant
qlikAuth.setDefaultHostConfig(qlikConfig);

//access token method the frontend will call
app.post("/access-token", requiresAuth(), async (req, res) => {
  const userId = req.session?.user?.id;
  try {
    //call to Qlik Cloud tenant to obtain an access token
    const accessToken = await qlikAuth.getAccessToken({
      hostConfig: {
        ...qlikConfig,
        userId,
        noCache: true,
      },
    });
    console.log("I got an access token!");
    //access token returned to front end
    res.send(accessToken);
  } catch (err) {
    console.log(err);
    res.status(401).send("No access");
  }
});
Or using the fetch API:const hostConfig = { host: "https://tenantName.region.qlikcloud.com", }; const payload = { client_id: "OAuth impersonation client Id", client_secret: "OAuth impersonation client secret", grant_type: "urn:qlik:oauth:user-impersonation", user_lookup: { field: "subject", value: "SUBJECT_VALUE", }, scope: "user_default", }; async function getAccessToken(hostConfig, payload) { const getToken = await fetch(`${hostConfig.host}/oauth/token`, { method: "POST", mode: "cors", credentials: "include", headers: { "Content-Type": "application/json", }, body: JSON.stringify(payload), }); const response = await getToken.json(); //console.log(response); return response; } (async () => { await getAccessToken(hostConfig, payload); })();Once you have the backend that generates the access token built, you can access it on the frontend in the qlik-embed library by using the "data-get-access-token" attribute and passing it the name of the function that calls your access token backend API endpoint, like this:
    <script crossorigin="anonymous" type="application/javascript"
        src="https://cdn.jsdelivr.net/npm/@qlik/embed-web-components@1/dist/index.min.js"
        data-host="<YOUR TENANT>" data-client-id="<YOUR CLIENT ID>"
        data-get-access-token="getAccessToken" data-auth-type="Oauth2"></script>

    <script>
        async function getAccessToken() {
            const response = await fetch("<BACKEND API URL>/access-token", {
                method: "POST",
                credentials: "include",
                redirect: "follow",
                mode: "cors"
            });
            if (response.status === 200) {
                const tokenResp = await response.json();
                const accessToken = tokenResp.access_token;
                return accessToken;
            }
            const err = new Error("Unexpected serverside authentication error");
            err.status = response.status;
            err.detail;
            throw err;
        }
    </script>
You can visit qlik.dev for more information about authentication concepts.
The qlik-embed library continues to evolve, bringing powerful new features and enhanced security capabilities to the table. Whether you're creating dynamic visualizations on the fly or implementing different auth methods, qlik-embed provides the tools needed for bring Qlik analytics into your web applications.
-
-
Talend Data Catalog 8.1 is Here!
Talend Data Catalog 8.1 is Here! Author(s): Don Pinto & Christophe Toum Effective data governance hinges on rich metadata from diverse sources, provid... Show MoreTalend Data Catalog 8.1 is Here!
Author(s): Don Pinto & Christophe Toum
Effective data governance hinges on rich metadata from diverse sources, providing context and enabling easy discovery of siloed assets. Managing this metadata is crucial for understanding data origins, changes, and access control. Without it, companies struggle with data quality, productivity, and compliance.
Building on the success of previous versions, Talend Data Catalog (TDC) 8.1, released in May 2024, effectively addresses these challenges. Here are a few top-level TDC 8.1 release highlights:-
- Enhanced metadata bridges mean that with TDC 8.1, you can start harvesting metadata from even more sources including dbt (core and cloud), Couchbase, Databricks, Unity Catalog and Spark notebooks, GraphQL, Snowflake access history, and more. This enables you to discover data across various sources - regardless of where it’s stored.
- Business Process Model and Notation (BPMN) standard support means that with Talend Data Catalog 8.1, you can create standardized process models that are easier to understand and collaborate on, and seamlessly integrate with third-party applications like Lucidchart.
- Improved data documentation and mapping brings better user experience for editing descriptions, comments, and issues with the HTML-based editor, the ability to creating semantic mappings linked with business glossary terms. As a result, the data models are more accurate, understandable, and trustworthy for everyone in the organization.
- More scalable search is powered by Solr - instead of a Lucene index, and the worksheets capability revolutionizes how you find and organize information. This capability significantly enhances and scales data discovery, especially for larger datasets, boosting productivity for governance stakeholders.
Now, we have just shared a few key capabilities of the release, but if you want to dive deeper, you can find the official release notes here.
For on-premise TDC 8.0 deployments, now is the time to upgrade. For customers using the managed cloud version of TDC 8.0, we are planning to schedule a migration to TDC 8.1 before the end of year 2024, and customers will be notified prior to this migration. Customers with a current TDC 8.0 subscription can get TDC 8.1 without additional cost. To help you realize these benefits as quickly as possible, reach out to your Qlik contact to engage and kick-start your TDC migration.
- Enhanced metadata bridges mean that with TDC 8.1, you can start harvesting metadata from even more sources including dbt (core and cloud), Couchbase, Databricks, Unity Catalog and Spark notebooks, GraphQL, Snowflake access history, and more. This enables you to discover data across various sources - regardless of where it’s stored.
-
Qlik のデータ統合と品質ビジネスにとって決定的な年
本ブログは"A Monumental Year for Qlik’s Data Integration and Quality Business"の翻訳です。 著者:Drew Clark データ統合の分野では昨年、巨額の買収や噂など、さまざまな紆余曲折がありましたが、ChatGPT やその他の大規模... Show More本ブログは"A Monumental Year for Qlik’s Data Integration and Quality Business"の翻訳です。
著者:Drew Clark
データ統合の分野では昨年、巨額の買収や噂など、さまざまな紆余曲折がありましたが、ChatGPT やその他の大規模言語モデルの登場ほど、地殻変動をもたらすインパクトが大きいものはありませんでした。AI は主流となり、私がお話をしてきたほぼすべての企業が、競争優位のために戦略的に AI 導入を進めています。
さらに、私はすべてのお客様に、「AI の成功は、正確でタイムリーかつ高品質なデータを、すぐに利用できる形式で用意できているかにかかっています」と伝えています。この哲学は、今年の Qlik Connect で私が発表したすべての製品開発における指針です。お話しすべき製品のリストは長くなりますが、まずは Qlik Talend Cloud から始めましょう。
Qlik Talend Cloud ビジョンの紹介
Qlik Talend Cloud は、Talend と組み合わせた初のサービスであり、私たちのジャーニーにおける極めて重要なステップです。将来の SaaS データ統合、品質、AI イノベーションの舞台を整えるだけでなく、最先端のソリューションを提供するという当社のコミットメントを体現しています。万を超えるテナント、複数の地域、10以上の認定を持つ Qlik Cloud インフラストラクチャを基盤とするこのプラットフォームは、当社の新たなイノベーションの道標としての役割を果たします。さらに、Talend Cloud の機能も時間をかけて移行していきます。
Qlik Talend Cloud の導入により、私たちは市場にイノベーションのビッグウェーブをもたらします。この新しいプラットフォームは、信頼できるデータ資産を組織全体に提供する、AI を活用した ELT パイプラインをノーコードで迅速に構築・展開することを可能にします。それでは、データ統合と品質プロセスに具体的なメリットをもたらす Qlik Talend Cloud の機能と主要テーマを掘り下げてみましょう。
革新的なデータ製品 - データ製品は、高度にキュレートされた、信頼できる、再利用可能なデータ資産であり、データ生産者と消費者の間のギャップを安全に埋めるものです。これらのデータセット、ビジネスで承認されたメタデータ、およびドメインロジックのコレクションは、レコメンデーションエンジン、予測機械学習、ビジネスアナリティクス、および生成 AI のような強力なデータアプリケーションのバックボーンを形成します。
キュレートされたデータマーケットプレイス - 私たちのデータ製品ビジョンのもう一つの要素は、データ製品のコラボレーションと消費を促進するデータマーケットプレイスを提供することです。マーケットプレイスに自然言語検索を導入することで、データ製品の発見、理解、共有を極めて直感的かつ容易にすることを想定しています。
モダンデータエンジニアリング - データパイプラインと変換ロジックを定義するための当社独自のノーコード/プロコードアプローチも飛躍的な進歩を遂げました。組み込まれた AI 技術のおかげで、コネクタファクトリーは大幅にアップグレードされ、現在では 170以上の SaaS データソースをサポートし、毎月さらに多くのソースをリリースしています。ちなみに、必要なデータソースコネクタが見つからない場合は、こちらからリクエストしてください。
また、Stitch Data の SaaS データロード技術を Qlik Talend Cloud に組み込みました。新しい Starter Package は、SaaS データをデータウェアハウスにロードしたいお客様に最適です。Starter Packageの素晴らしい点は、SAP 接続、データ変換、データ製品などのより高度な機能へのシームレスなパスも提供されることです。今年後半に Qlik Talend Cloud Starter Package やその他のエディションが発売される予定なのでお楽しみに。
データ変換の話をしていましたが、Transformation Flows の導入も、これらの機能も大幅にアップグレードします。Talend Cloud のパイプラインデザイナーをベースにしたシンプルなドラッグ&ドロップのインターフェースにより、データエンジニアも SQL の専門家でない人も、視覚的な変換フローを簡単に作成できます。ELT データパイプラインの一環として、カスタム SQL コードの代替として変換フローを使用できます。
Qlik Talend Cloud は、変換フローを SQL 文に変換し、オーケストレーションし、実行時に選択したデータプラットフォームにプッシュします。Snowflake、Databricks、Google Big Query、Azure Synapse Analytics、Microsoft Fabric はすべてサポートされています。
スキルに関係なく、すべてのデータエンジニアに適したデータ変換機能が充実しています。ポイント&クリックで完全に自動化されたデータマートを作成したり、ドラッグ&ドロップで変換フローを作成したりできます。独自の SQL をコーディングするスキルがない場合は、自然言語のプロンプトから SQL 変換を生成する新しい AI アシスタントを使用することもできます。データ変換の詳細については、このリンクをご確認ください。
AI イノベーション - さまざまな AI イニシアチブの展開を支援する生産性とインフラストラクチャ機能を多数追加しました。カスタム SQL を使用して、機械学習(ML)モデルをトレーニングするためのデータセットを照合することができます。今年の後半には、Databricks の AI 機能を特別にサポートする変換フロープロセッサを追加して、この機能を強化する予定です。また、ベクトルデータベースのサポートや、RAG(Retrieval Augmented Generation)アプリケーションをサポートするデータパイプラインの構築を支援する複数のLLM も追加しました。構造化データソースと非構造化データソースを企業コーパスに使用する機能を提供することで、またもやイノベーションを実現しています。同時に、Snowflake Cortex のサポートも拡大しています。最後に、データエンジニアがデータパイプラインを構築しながら「会話」できるチャットインターフェースも追加しました。この便利な副操縦士のような機能は、データ品質ルールの構築、カラムの標準化、データ探索などの開発タスクを加速します。新しい AI 機能の詳細については、こちらのリンクをご覧ください。
パイオニア的存在の Trust Score for AI
また、「Trust Score for AI」と呼ばれるさらなる AI イノベーションを発表できることを誇りに思います。このユニークな製品とサービスは、AI プロジェクトで使用されるデータの主要な品質指標を確立し、監視するのに役立ちます。Qlik Trust Score for AI は、AI データの全体的な品質を反映する単一の分かりやすいスコアを提供することで、AI データセットの信頼性を評価するように設計されたシステムです。
サンプルデータセットまたはご自身のデータで信頼スコアをこちらから体験してください!
クライアントマネージド製品の強化
これまで Qlik Talend Cloud についてお話してきましたが、私たちはクライアントマネージド製品への投資を続けていることを強調したいと思います。私たちは企業における導入の現実を理解しており、お客様のインフラやワークロードがすべてクラウドで稼働するわけではないことを認識しています。業界の他の多くのベンダーのように、クラウドへの移行を強制しているわけではありませんし、データ処理のワークロード実行場所を選択する自由を引き続きサポートします。この 1年の製品アップデートをすべて挙げることはできませんが、ハイライトをいくつかご紹介します。
- Talend Studio の機能強化 - Talend Studio の UI に、すべての開発者にアピールする新鮮でモダンなルック&フィールを採用しました。
- Studio の生成 AI パイプライン – RAG ベースの要件向けにベクトルデータベースと LLM エンベディングをサポートする新しいコンポーネントも追加し、プラットフォーム全体に AI 機能を織り込むというテーマを継続しました。
- Snowpipe Streaming - 昨年発表した Snowflake Cortex は唯一のイノベーションではありません。Qlik Replicate は Snowpipe Streaming のサポートもリリースしました。これはSnowflake にデータをロードする新しい方法で、バルクロードとは対照的に Snowflake のテーブルに直接ロードすることで、レイテンシーの短縮とコストの削減に貢献します。
- FIPS コンプライアンス - Qlik Replicate May 2024 リリースでは、標準セットアップルーチンの一部として FIPS コンプライアンスがサポートされています。
- API サポートの強化 - Qlik Enterprise Manager API を拡張し、特定のタスク内でテーブルを追加・変更できるようになりました。
最後に
この1年はデータ事業部を率いてのエキサイティングな1年でした。今回発表した私たちのビジョン、イノベーション、そして製品をこれ以上ないくらいに誇りに思います。将来に向けて、データ統合と品質ソリューションが最先端の AI 開発を確実に促進するために前進したことは明らかであり、これらの強力なツールが私たちの働き方や生活に革命を起こし続けることを確信しています。私たちは正しい道を歩んでおり、お客様や業界アナリストからもそのようにご認識いただいています。今後のさらなるエクサイティングな進化にご注目ください。
-
QlikView - New Security Patches Available Now
Update 21st of March 16:00 CET: published CVE numberUpdate 27th of March 10:45 CET: added FAQ Hello Qlik Users, A security issue in QlikView has been ... Show MoreUpdate 21st of March 16:00 CET: published CVE number
Update 27th of March 10:45 CET: added FAQHello Qlik Users,
A security issue in QlikView has been identified and patches have been made available. Details can be found in the Security Bulletin High Severity Security fix for QlikView (CVE-2024-29863).
Today, 20th of March 2024, we have released two service releases across the latest versions of QlikView to patch the reported issue. All versions of QlikView prior to and including the releases below are impacted:
- QlikView May 2023 SR1 (12.80.20100)
- QlikView May 2022 SR2 (12.70.20200)
Call to Action
As no workarounds can be provided, Customers should upgrade QlikView to one of the following versions that contain the fix:
- QlikView May 2023 SR2 (12.80.20200)
- QlikView May 2022 SR3 (12.70.20300)
This issue only impacts QlikView. Other Qlik data analytics products including Qlik Cloud and Qlik Sense Enterprise on Windows are not impacted.
Additional Details
- All Qlik software can be downloaded from our official Qlik Download page (customer login required). Follow best practices when upgrading QlikView.
- Qlik provides patches for major releases until the next Initial or Service Release is generally available. See Release Management Policy for Qlik Software.
- Notwithstanding, additional patches for earlier releases may be made available at Qlik’s discretion.
- The information in this post and Security Bulletin High Severity Security fix for QlikView (CVE-2024-29863) is disclosed in accordance with our published Security and Vulnerability Policy.
The Security Notice label is used to notify customers about security patches and upgrades that require a customer’s action. Please subscribe to the ‘Security Notice’ label to be notified of future updates.Frequently Asked Questions
Q: Is the vulnerability present in the QlikView Plugin or other QlikView products?
A: The vulnerability is related to the MSI files on disk.Q: Will deleting the MSI files mitigate the issue?
A: Qlik does not consider removing the MSI files a complete workaround. A server user can restore them. -
Creating a Collapsible Filter Panel
In my last blog / video. I showed you how to easily create visual buttons to apply selections and change their visual selection state so they can appe... Show MoreIn my last blog / video. I showed you how to easily create visual buttons to apply selections and change their visual selection state so they can appear enabled or disabled (selected, not-selected). In this video I'll show you how to setup a filter panel using buttons and the layout container to create a simple collapsible filter panel that is both esthetic and functional while also providing real estate for your dashboard objects.
Resources:
- Sample attached
- More Tips and Tricks
-
How to Calculate Duration when you have only one date time column
In this video I quickly show you how to create a duration column using 1 single date / time column. This comes in handy when wanting to calculate diff... Show MoreIn this video I quickly show you how to create a duration column using 1 single date / time column. This comes in handy when wanting to calculate differences in time period values stored in the same column.
- Sample .QVF attached
- Qlik Help Reference: Previous()
- Telemetry app mention
-
Complete your Qlik Nation challenges in Qlik Community
Transformational. Innovative. Powerful. These are just a few of the inspiring terms customers use to describe Qlik and our product suite. Customer fee... Show MoreTransformational. Innovative. Powerful. These are just a few of the inspiring terms customers use to describe Qlik and our product suite. Customer feedback and input are critical to Qlik’s success, and we regularly hear directly from our most active users through Qlik Nation, our gamified customer engagement hub.
Through interactive challenges and activities, Qlik Nation members connect, learn, and engage with Qlik and with each other. By completing challenges in the platform, members can receive early notification of new product features, boost knowledge through quality educational content, and have opportunities to influence the product roadmap. Qlik Nation also allows customers to demonstrate skills, network with peers, and amplify their personal brand. All while having fun and being rewarded!
And now, Qlik Nation members will be able to complete challenges while visiting Qlik Community. Current members will see a new carousel on the Qlik Community homepage inviting them to complete challenges, making it even easier for you to engage and earn points.
Customers are at the heart of everything we do, and Qlik Nation offers an exclusive experience for our most dedicated and passionate fans (Qlik Nation is a complementary platform to Qlik Community, which has open membership). What do our members say about their experience in Qlik Nation?
- “It’s a fantastic opportunity to link up with technologists and data enthusiasts across a wide array of industries to learn and promote the best use of the Qlik product suite.” – Howard Teall, Enterprise Architect, HSBC & Qlik Luminary
- “Qlik Nation brings together all the news and knowledge in one place, keeping me up to date with Qlik and the world of data & analytics” – Mark Little, Senior Business Intelligence Specialist, Mayborn Group
- “Qlik Nation has provided me with a platform to keep me motivated and try and do better with our analytics platform and capabilities. The community joins you with like-minded individuals to share and promote everything Qlik.” - Willem Jacobs, Head of Analytics, OneLogix
If you’re a Qlik end-user and want to learn more about how to join Qlik Nation, please email QlikNation@qlik.com. We’d love to hear from you!
-
Qlik Connect 2024 に参加してきました!
本年 6月 3日から 5日にかけて米国オーランドにてQlik Connectが開催されました。日本からは 40名近いお客様・パートナー様が参加されました。その模様をお送りします。 初日は午後からパートナー様向けのセッションが開催されるため、パートナーの皆様は、20時間近くのフライトを苦ともせず(?)... Show More本年 6月 3日から 5日にかけて米国オーランドにてQlik Connectが開催されました。日本からは 40名近いお客様・パートナー様が参加されました。その模様をお送りします。
初日は午後からパートナー様向けのセッションが開催されるため、パートナーの皆様は、20時間近くのフライトを苦ともせず(?)、一足早く続々と現地入りされました。
夕方からはすべての参加者を対象としたウェルカムパーティが開催され、ここで他の日本からの参加者との初めましてのご挨拶となります。また Qlik エグゼクティブも参加しているので一緒に記念写真を撮られた方も多数いらっしゃいました。
4日は基調講演からスタートです。Qlik の本格的な AI への取り組みや新製品Qlik Talend Cloud と Qlik Answers の発表、AI Council からの提言などが発表されました。
その後は 100を超えるブレイクアウトセッションと、Qlik やスポンサーパートナーの展示パビリオンなど消化しきれないくらいのコンテンツが用意されていました。また、この日は「Rapidly Unlocking Enterprise Data Value To Gear Up for the GenAI Challenge」と題したパネルディスカッションに富士通の池田様がご登壇、集まったグローバルオーディエンスに対し、同社での AI やデータの取り組みを(もちろん英語で)ご紹介されていました。
この日の夜にはホテル近くのダイナーで Japan & APAC Night を開催。日本とアジアからの参加者80名ほどが国を超えた情報交換や、ボウリング、ビリヤードなどを楽しまれていました。
5日の午前中はグローバルパートナー(アクセンチュアと AWS)やゲスト講演の講演に加え、恒例のトランスフォーメーションアワードが発表されました。今年から新たに設定された5つの部門の一つである Data Mastery アワードを富士通様が受賞されました。おめでとうございます!昨年のホンダ様に続き日本から2年連続の受賞となりました。
午後は前日と同じようにブレイクアウトセッションとパビリオン巡りとなります。2日目だと少し余裕ができてきたのか、ブースでじっくりとお話を聞かれる方が多かったようです。特に新製品の Qlik Answers のブースは質問したい方が絶えることがありませんでした。
そして夜は全員参加の Appreciation Dinner と称して、ユニバーサルスタジオへ移動です。なんとアイランズ・オブ・アドベンチャーを貸切り、敷地内のあちこちに屋台形式で食事が用意され、Jurassic World VelociCoaster や Hagrid’s Magical Creatures Motorbike Adventure などのライドが乗り放題でした。
v
あっという間の 3日間でしたが、参加された方からは「Qlik の最新情報を体感できた」「同じ情報でも担当者や関係者から直接聞くと理解が全く違いました」「他の海外参加者の話が大変参考になった」「Qlik 関係者は参加必須ですね」などの嬉しいお言葉をいただきました。
Qlik Connect で発表された内容はこれから Qlik Japan チームが皆様にお届けしてまいります。ご期待ください。また、来年の Qlik Connect の日程と場所も発表されました。来年 5月 13日にフロリダでお待ちしています!
-
Creating a Qlik Sense App Thumbnail with Adobe Express Web
Give your Qlik Sense Apps some style. Make them stand out in the Qlik Cloud Hub with eye catching and visually pleasing thumbnails. See how I use Adob... Show MoreGive your Qlik Sense Apps some style. Make them stand out in the Qlik Cloud Hub with eye catching and visually pleasing thumbnails. See how I use Adobe Express to quickly and easily give my Qlik Sense Apps some polish.
Full Video:
https://youtu.be/n8y0GINxDu0
Full Playlist:
https://www.youtube.com/playlist?list=PLW1uf5CQ_gSqF5bcmbBrk1q7Q4-h899V1
-
Discovering qlik-embed: Qlik’s new library for Embedding Qlik Sense in web apps
In previous posts on the Design blog, we've explored various ways for embedding Qlik Sense analytics. These have ranged from straightforward iFrames t... Show MoreIn previous posts on the Design blog, we've explored various ways for embedding Qlik Sense analytics. These have ranged from straightforward iFrames to more complex approaches like the Capabilities API, as well as more recent tools such as Nebula.js and Enigma.js.
Today, we’re going to be taking a quick look at a new library from Qlik called qlik-embed, but before diving into it, I would like to clarify that this library is currently in public preview and at the time of writing this blog, frequent updates as well as breaking changes are prone to happen (you can read more about that on qlik.dev or follow the Changelog for updated https://qlik.dev/changelog)
So what exactly is qlik-embed?
qlik-embed is a library for easily embedding data and analytics interfaces into your web apps while overcoming some of the concerns that usually arise when embedding content from one software application to another such as third-party cookies, cross-site request forgery, content security policy etc..
The library is designed to work with web apps from simple plain HTML ones to more modern frameworks like React etc.. That is in fact made easier since whichever qlik-embed flavor you use, the configuration options, the methods, and the properties will be similar.
If you are already embedding Qlik Sense content into your web applications, you can learn about the various reasons why qlik-embed would be a better solution on qlik.dev (https://qlik.dev/embed/qlik-embed/qlik-embed-introduction#why-qlik-embed-over-capability-api-or-nebulajs)
Web Components:
qlik-embed makes use of web components which are basically custom HTML elements in the form of <qlik-embed> </qlik-embed> HTML tags that allow you to configure properties of the content you’re embedding
You can find all supported web-components here:
How to quickly get started?
Before getting started, it’s worth noting that there are several ways to connect qlik-embed web components to Qlik.
More information about Auth can be found here:
- Connect qlik-embed: https://qlik.dev/embed/qlik-embed/connect-qlik-embed
- Best Practices: https://qlik.dev/embed/qlik-embed/qlik-embed-auth-best-practice
You can connect to qlik-embed in these ways:
- Qlik Cloud API keys (cookie-less)
- Qlik Cloud OAuth2 clients (cookie-less)
- Qlik Cloud interactive login (cookies)
- Qlik Sense Enterprise Client Managed interactive login (cookies)
- None (This is a more advanced option and requires handling authenticated requests using a custom authorization backend proxy - learn more about that here: https://qlik.dev/authenticate/jwt/jwt-proxy/)
In this post, we’re going to use OAuth2 Single-page-app from the Qlik Cloud tenant Management Console under oAuth:
Example using HTML Web Components:
Reference page: https://qlik.dev/embed/qlik-embed/qlik-embed-webcomponent-quickstartFirst thing we need to do is add a <script> element in the <head> tag to configure the call to the qlik-embed library and set up the attributes relevant to the connection we choose.
<script crossorigin="anonymous" type="application/javascript" src="https://cdn.jsdelivr.net/npm/@qlik/embed-web-components" data-host="<QLIK_TENANT_URL>" data-client-id="<QLIK_OAUTH2_CLIENT_ID>" data-redirect-uri="<WEB_APP_CALLBACK_URI>" data-access-token-storage="session" > </script>- data-host is the URL to your Qlik Cloud tenant. For example https://example.us.qlikcloud.com/
- data-client-id is the client ID for the single-page application OAuth2 client registered for this web application.
- data-redirect-uri is the location of the web page the OAuth2 client will call back to when authorization requests are made from your web application to your Qlik tenant. This web page should be added to your web application.
web-component:
<qlik-embed ui="classic/app" app-id="<APP_ID>"></qlik-embed>oauth-callback.html:
<!DOCTYPE html>
<html lang="en">
  <head>
    <meta charset="utf-8" />
    <script
      crossorigin="anonymous"
      type="application/javascript"
      data-host="<QLIK_TENANT_URL>"
      src="https://cdn.jsdelivr.net/npm/@qlik/embed-web-components/dist/oauth-callback.js"
    ></script>
  </head>
</html>
You can fork the full example here and change the “Tenant URL” and the rest of the attributes to your own tenant after creating the OAuth SPA config: https://replit.com/@ouadielim/qlik-embed-HTML-Web-Components#index.html
result:
Example using React:
In React, you can use qlik’s embed-react library package: npm install @qlik/embed-react (https://www.npmjs.com/package/@qlik/embed-react)
Then, you can import QlikEmbed and QlikEmbedConfig from @qlik/embed-react. React’s context is used to pass in the hostConfig that you configure to point to your Qlik Cloud Tenant (host) and use the OAuth 2 config (clientId). The redirect URI needs to point to a page which is similar to what we did above in HTML web components.
import { QlikEmbed, QlikEmbedConfig } from "@qlik/embed-react";

const hostConfig = {
  host: "<QLIK_CLOUD_TENANT>",
  clientId: "<CLIENT_ID>",
  redirectUri: "https://localhost:5173/oauth-callback.html",
  accessTokenStorage: "session",
  authType: "Oauth2",
};
const appId = "<APP_ID>";
const sheetId = ""; // sheet id or empty string

export default () => (
  <QlikEmbedConfig.Provider value={hostConfig}>
	<div className="container">
      <h1>Qlik Embed with React</h1>
	      <div className="selections-bar">
        <QlikEmbed ui="analytics/selections" appId={appId} />
      </div>
      <div className="viz">
        <QlikEmbed ui="classic/app" app={appId} sheet={sheetId} />
      </div>
      <div className="viz">
        <QlikEmbed ui="analytics/chart" appId={appId} objectId="hRZaKk" />
      </div>
	  </div>
  </QlikEmbedConfig.Provider>
);
You can clone the full React example here: https://github.com/ouadie-limouni/qlik-embed-react
result:
Limitations ?
There are a few limitations to qlik-embed as it continues to develop into a more stable and robust library - you can read more about those on qlik.dev: https://qlik.dev/embed/qlik-embed/qlik-embed-limitations
Like I mentioned at the very beginning, qlik-embed is new and evolving quickly, I invite you to test it to get familiar with it early and stay tuned for more updates and bug fixes as they come out using the Changelog page.
I hope you found this post helpful, please let me know in the comments below if you have any questions!
Thanks
- Ouadie -
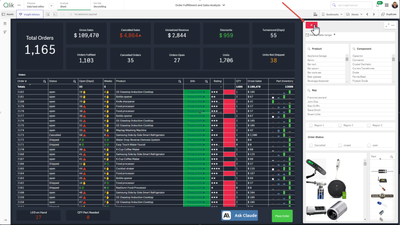
Qlik Introduces a New Era of Visualization
Our ability to tell stories is an art form as old as language itself. From ancient cave paintings to oral traditions passed through generations, the e... Show MoreOur ability to tell stories is an art form as old as language itself. From ancient cave paintings to oral traditions passed through generations, the essence of stories has evolved alongside our communication methods. It began with visual tales etched on cave walls, transitioned into spoken narratives, and eventually found its way into written, printed, and typed forms.
Ultimately, modern analytics and visualizations serve the same purpose as sharing and retelling stories: guiding business users to make important and informed decisions. These decisions, however, are not made alone, and require stories to persuade and engage others, often in boardrooms or video calls. But the goal of the story remains unchanged: to inspire action, instill confidence, and ensure safety.
So, what happens in the next chapter?
Today, Qlik is proud to announce a new era in data visualization and dashboard design. With the latest advancements in Qlik, you can bid farewell to the days of grappling with custom style sheets and juggling third-party add-ons. It's time to explore your creativity and take control of your narrative like never before!
Chapters:
1. The layout container adventure
Picture this: designing beautiful dashboards that are not only interactive but also fun and easy. Say hello to the Layout container, your new-found playground for creativity. Stack objects, craft custom and composite KPIs, and toggle individual object visibility with ease. With multi-selection, grouping, and a plethora of styling tools at your fingertips, designing experiences just got a whole lot faster and more intuitive. Need inspiration? Dive into this vibrant dashboard crafted by Luis Felipe Tensini, Qlik Partner Ambassador, and prepare to be amazed.
2. Charting new narratives & filter pane styling
It's not just about data; it's about presentation. You now have the power to improve the way you tell your story. Control borders, shadows, fonts, and more to add depth and personality to your visualizations while maintaining your company's branding. Explore data effortlessly with customizable filter panes. From grid mode to compact views, from checkboxes to radio buttons, tailor your data display for a truly immersive user experience.3. Cyclic group dimensions delivered
Cyclic groups for Master Item Dimensions—another QlikView legendary feature delivered. Allowing users to dynamically cycle through dimensions in every chart, maximizing the potential to tell stories while conserving screen space. With this innovation, charts become versatile tools, accommodating multiple use cases effortlessly. Crafting compelling narratives is simplified: select the Cyclic option in the master items library, choose desired fields, and effortlessly switch between them in your chart.4. A tale of dashboard themes…enhanced
Plot twist! We've introduced enhancements, including new straight tables, pivot tables, line objects, and rich text objects. Take command of your space with the ability to control the visibility of the main selection toolbar and sheet header, freeing up valuable real estate for content and custom navigation bars.Cliff notes: Visualizations have undergone a remarkable makeover. You now have permission to evoke the freedom of creativity, captivate your audience, and transform data into insights like never before. The future with Qlik Cloud is bright!
From ancient cave tales to today's dynamic dashboards, the evolution of storytelling parallels human communication methods. Innovation ushering in a future where every data point tells a tale waiting to be explored.
Your adventure into the world of Visualizations & Dashboards does not stop here… continue your journey and check out the ‘What’s New: Qlik Showcase App’ or these new and improved stylish apps below and see for yourself!
In the grand scheme of things, Qlik’s evolution promises freedom, creativity, and limitless possibilities in data visualizations. The only limit is your imagination.
Highlights:
- Filter pane styling: styling options for the filter pane
- Chart Border and Shadow: More control for app developer. Use it to create depth effect, enhance or hide the border. Perfect for layout container. Overrides the theme setting.
- Layout Container: Freeform layout for grouping and stacking. New way to create content and design dashboards
- Pivot Table: New pivot table and will replace native pivot in the future
- Styling improvements: Grid, Funnel and Sankey chart is getting styling
- Copy and paste style: Transfer styling settings from one chart to another
- Cyclic master dimensions
Helpful Links:- What’s New in Qlik Cloud
- Technical preview
- Visualization Update | Qlik YouTube
- How to Create Visual Button Selection States | Do More with Qlik
- How to Create Collapsible Filter Panel | Do More with Qlik
- Cyclic Group Dimensions | SaaS in 60
Inspiration from Qlik Community: -
Looping through cloud-based file data using a metadata connector (video)
In today's blog....as promised, Qlik Solution Architect Tomilayo Komolafe (Tomi) is back providing real in-the-trenches solutions to real customer pro... Show MoreIn today's blog....as promised, Qlik Solution Architect Tomilayo Komolafe (Tomi) is back providing real in-the-trenches solutions to real customer problems. ( If you missed Tomi's introduction to the Qlik Design Blog and our last post / video, you can visit this link - Contact Tracing with Qlik Sense SaaS - and Active Intelligence Solution.)
When working with a Qlik customer, Tomi stumbled upon a particular problem of not being able to iterate over, or loop through, file data stored in a cloud-based platform. Tomi recorded a video of the particular solution, which I embedded below along with some sample data and a sample Qlik Sense App.(attached below) - I would like to mention that Tomi borrowed some Qlik script for this solution from Qlik MVP and Luminary @stevedark of Quick Intelligence fame. I would like to also thank Steve for his valuable contributions, not only to help make this solution easy and possible but also for all the help he provides to our Qlik Community members (reference material links below). 👍 - Thanks Steve and Tomi for demonstrating teamwork for results a Qlik core value to help our customers.Before we get started - a word from our sponsor 😁
- Don't forget to sign up for our next Do More with Qlik - next week 4/8 @ 2PM - where Jeff Goldberg and I will cover Qlik Sense SaaS and our new Webhooks integration.
Register here:
The Problem
The problem was observed when recently working with a customer who needed to bring in 800+ csv files stored in his company’s OneDrive shared folder location into Qlik. If the files were stored in his local directory, he could use Qlik’s wildcard character to ingest many of these files. Something as simple as “*.csv” for example would have returned all files that are CSVs in his lib file path. Unfortunately, many of these cloud vendor options such as Google Drive, OneDrive, Dropbox, etc, don’t allow for use of special characters in their environment. Obviously, he would’ve needed to load all 800 CSV files individually right? 😉
Luckily, there’s a solution that automates this process in Qlik and still provides enough flexibility for the end user. Watch this video to learn how and note the links and reference materials below - including sample solution and data attached.
Can't see the video? YouTube blocked by your region or organization? Download LoopFiles.zip for a copy of the .mp4 file that you can download and watch on your computer or mobile device.
Reference: (Steve Dark solutions)
Files:
- sample_data_and_app.zip
- Extract .xls files to cloud-based storage location of your choice (OneDrive in this example)
- Import .QVF file
- Add / Edit Metadata / cloud data source connections appropriately
Qlik Help:
- Don't forget to sign up for our next Do More with Qlik - next week 4/8 @ 2PM - where Jeff Goldberg and I will cover Qlik Sense SaaS and our new Webhooks integration.
-
Managing your Analytics lifecycle in Qlik Cloud Analytics - UPDATE!
Introduction The majority of customers use some form of software development lifecycle in their organizations. When moving to SaaS customers are somet... Show MoreIntroduction
The majority of customers use some form of software development lifecycle in their organizations. When moving to SaaS customers are sometimes unsure of if or how to apply these techniques to a Qlik Cloud Analytics tenant.
We will explore some of the technical processes that need to occur within or interacting with a Qlik Cloud Analytics tenant as part of a software development lifecycle. We look at a number of areas including setting up your tenant in a way that supports your SDLC, encouraging re-use, building context aware applications, and many other topics. Qlik Cloud Analytics runs on Qlik Cloud, Qlik’s SaaS platform for our customer’s data analytics and data integration needs. We see customers being able to manage their entire data landscape and are continually expanding our cloud offerings. We have introduced new services such as Data Integration, Application Automation, Machine learning and AI, as well as adding many new features to Qlik Cloud Analytics. While there are many other areas where Qlik Cloud can be integrated into your SDLC, this document will focus on Qlik Cloud Analytics.
The aim of this document is not to provide a strict SDLC process for customers to follow, rather it aims to provide examples of how SDLC processes could work in a Qlik Sense Enterprise SaaS environment. We encourage you to implement or amend the parts or this you need so Qlik Sense Enterprise SaaS fits into your organization.
Read it all in the PDF attached in this post.
-
Qlik now supports HIPAA requirements for US Healthcare
Qlik is excited to announce that we have recently completed our SOC2 Type 2 + HITRUST attestation in addition to releasing Customer Managed Keys, an a... Show MoreQlik is excited to announce that we have recently completed our SOC2 Type 2 + HITRUST attestation in addition to releasing Customer Managed Keys, an advanced encryption offering for customers hosting data in Qlik Cloud. These additional levers of governance enable Qlik Cloud to now host Personal Health Information (PHI), subject to HIPAA requirements, and enable Qlik to enter into a Business Associate Agreement (BAA) with customers.
Qlik has invested heavily to support our customers through their journey into the cloud and this achievement illustrates Qlik’s commitment to ensure customers feel safe deploying their data into Qlik Cloud. Now US Healthcare customers can benefit from all of the advantages of Qlik Cloud like automation and AutoML with the peace of mind that compliance is fulfilled.
Advanced Data Encryption
We launched Customer Managed Keys, a security offering in Qlik Cloud which allows customers to bring their own encryption keys (BYOK) to protect the data stored at rest in their Qlik Cloud tenant.
Customers can now host PHI and sensitive data in Qlik Cloud with trust and take advantage of SaaS and the full potential of Qlik Cloud. US Healthcare organizations can leverage the power of Qlik Cloud to enhance patient outcomes, improve service delivery, and close the gaps between data insights and actions.
To learn more about Customer Managed Keys, watch the video here.
Summary
Qlik Cloud delivers enterprise data integration and world-class analytics into a single platform and through our advanced encryption services we can support customers become data-driven and navigate their HIPAA compliance requirements.
To learn more about Qlik Cloud for US Healthcare, visit our website.
-
Calculated Fields
Normally, new fields are created in the script and stored as additional columns in the data model. Just write your expression inside a Load statement ... Show MoreNormally, new fields are created in the script and stored as additional columns in the data model. Just write your expression inside a Load statement and you’re done:
But you can also do the same thing in the user interface, and then it could look like this:
So, which way should you do it?
Generally, I would say that you should put as much as possible in the script. In most cases, it is far better to have these calculations pre-made, so that they do not have to be calculated at run-time, i.e. when the user clicks.
The Qlik Engine has two fundamentally different ways to calculate such expressions: As “Calculated dimension” or as “Field-on-the-fly”. The engine automatically decides how a specific calculation should be made, depending on the expression.
Fields-on-the-fly
This method was introduced in one of the early versions of Qlik Sense. As the expression is evaluated, the engine creates an additional column in the data model, with a corresponding symbol table. Just as for a real field, the selection is stored in state vectors linked to this column.In the picture below you can see a table dimension defined as “=Year(Date)”, which results in four rows.
Now look at the selection bar: When a selection is made, the corresponding year is selected in the Field-on-the-fly called “=Year(Date)” – a field that does not exist in the original data model. And in the selection bar you can see that the selection is indeed stored in this “virtual” field, and not in the Date field.
Calculated dimensions
This is the old-fashioned way, and this is how QlikView still today does it. In the example below, the table dimension is “=Aggr(Year(Date),Date)” and it also results in four rows. Logically, this expression is equivalent to the above one.But here the selection is instead made in in the underlying field: in the Date field.
It is always possible to create a Calculated dimension, no matter what the expression looks like. But the same is not true for Fields-on-the-fly. There are limitations to when they can be generated:
- The expression must be based on one single field only, or on multiple non-key fields from the same table in the data model
- The expression cannot depend on the selection state, e.g. through the GetSelectedCount() function
- The expression cannot contain an Aggr() function
If a Field-on-the-fly cannot be generated, the expression will be evaluated as a Calculated dimension instead.
Performance
Both Calculated dimensions and Fields-on-the-fly can cause performance problems, so it is a good idea to consider moving them to the script instead. Fields-on-the-fly can almost always be moved to the script.For Fields-on-the-fly, the performance problems become especially severe if the underlying field has many distinct values. A common example is when calendar functions like Year and Month are used on a timestamp with millions of distinct values, rather than on a date with fewer values, like 2 x 365 dates. Further; since Fields-on-the-fly are added to the data model, and the hash of the data model is used in the ID of the cache entry, Fields-on-the-fly can prevent the cache from being re-used properly.
To improve the performance, Master dimensions containing Fields-on-the-fly are now (since Nov 2019) calculated already when the first user opens the app, something which can increase the time it takes to open a document. On the other hand, this will improve the response time considerably in the analysis phase, as well as mitigate cache problems, so we are confident that this is a correct decision. Hence, put your Fields-on-the-fly in the Master dimensions!
Should you want to tweak the behavior of the engine, you can always try the following:
- Using “UseAutoFieldOnTheFly=0” in Settings.ini will disable Fields-on-the-fly for all documents served by the engine
- Using “Set QlikInternalDisableFotfMode=1;” in the script will disable Fields-on-fly in the app
- Using “Set QlikInternalDisableFotfPregen =1;” in the script will prevent Fields-on-fly from being pre-calculated when the app is opened
- Wrapping the expression in “=CalcDim(…)” will force it to be a Calculated dimension
But most importantly - don't use a timestamp to create your calendar! Use a date instead:
Good luck!
HIC
Read also in Calculated Fields in Qlik Data Analytics .