Unlock a world of possibilities! Login now and discover the exclusive benefits awaiting you.
Data Integration & Quality
Forums for Qlik Data Integration solutions. Ask questions, join discussions, find solutions, and access documentation and resources
Explore Qlik Gallery
Qlik Gallery is meant to encourage Qlikkies everywhere to share their progress – from a first Qlik app – to a favorite Qlik app – and everything in-between.
About Qlik Community
Get started on Qlik Community, find How-To documents, and join general non-product related discussions.
Qlik Resources
Direct links to other resources within the Qlik ecosystem. We suggest you bookmark this page.
Qlik Academic Program
Qlik gives qualified university students, educators, and researchers free Qlik software and resources to prepare students for the data-driven workplace.
Recent Blog Posts
-
Checkout the New Pivot Table!
The New Pivot Table can quickly transform rows and columns into actionable insights with just a few clicks. You can organize, analyze, and visualize y... Show MoreThe New Pivot Table can quickly transform rows and columns into actionable insights with just a few clicks. You can organize, analyze, and visualize your data and even style various elements such as headers, borders, fonts, grid lines and more. Say goodbye to manual calculations and hello to dynamic summaries. Pivot Tables,. simplify complexity, reveal patterns, and take control of your information.
Try it now and elevate your data game to new heights.
Qlik Help: Pivot ObjectCan't See the video? - Check it out on Qlik's video site

-
Qlik Application Automation and Google Sheets connector: Scope change
Hello all, The Qlik Application Automation Google Sheets connector was modified to request a different set of scopes than it used to. This has an imp... Show More -
JOINS
JOINSBredenmasterVisually show and explain the main join that can be used in scriptDiscoverieseasily explain to people how relations between tables sh... Show MoreJOINSBredenmaster Visually show and explain the main join that can be used in script
Discoveries
easily explain to people how relations between tables should be done, and what it means for data
Impact
people easily can get and cross the right and confidence data, without thinking that you are affecting development
Audience
developers and analysts, during trainings and workshops
Data and advanced analytics
reliable data and optimal resources consumption
-
Qlik Datathon in India's Silicon Valley is a big success!
On August 8th, Kristu Jayanti College, Bangalore organised a datathon for its students in association with Qlik. Kristu Jayanti College is one of the ... Show MoreOn August 8th, Kristu Jayanti College, Bangalore organised a datathon for its students in association with Qlik.
Kristu Jayanti College is one of the leading colleges in Bangalore, also known as India's Silicon Valley. The college has multiple courses in engineering, business studies, arts, science, social sciences etc. More than 15,000 students study on the campus each year.
This was the first datathon organised by Kristu Jayanti and it was led by Dr. Kalaiselvi who is also the Qlik Educator Ambassador for 2024. She was supported by her staff members including Dr. Sasikumar, Dr. Sevuga Pandian, other faculties and students. A day prior, a bootcamp was led by Manikant Roy, Ph.d candidate from IIT Delhi, also an ex Professor.
More than 130 students participated in this day long event from 9 am to 7 pm. Students were given data sets with diverse topics such as Sales data, E Commerce data and data on Health. Most students were familiar with Qlik Sense since they had registered for the Qlik Academic Program previously and knew how to build dashboards and create visualisations. This event culminated into presentations by students and based on their output, three teams were selected as the winners.
Kristu Jayanti and the Qlik Academic Program will embark on many such initiatives to get students enabled in data analytics. To learn about how you can engage with us, if you are a student or a professor, visit qlik.com/academicprogram and benefit from a world class analytics training, software and qualifications!
-
KC Tech Checkpoint
KC Tech CheckpointPomerol PartnersAccess data surrounding the most in-demand Kansas City tech positions Explore the most common tech skills listed on ... Show MoreKC Tech CheckpointPomerol PartnersAccess data surrounding the most in-demand Kansas City tech positions Explore the most common tech skills listed on active KC tech job listings Review Kansas City versus U.S. tech workforce data Navigate the distribution of new, active and closed Kansas City tech jobs Compare Kansas City tech median wages in correlation with occupations, employers, certificates, industries, job titles and locations Browse Kansas City tech trend graphs featuring job listings and median wages by month Export custom reportsDiscoveries
In 2022, Pomerol transformed Kansas City Tech Council's monthly jobs report (previously a PDF report) into an interactive web mashup and mobile app that empowers business professionals to easily explore local tech workforce trends.
Impact
The transformation boosted engagement and increased email open rates by 11%.
Audience
Public, available to download here: https://www.kctechcouncil.com/kc-tech-checkpoint-app/
Data and advanced analytics
The delivery mechanism and data capturing (GPS, multi-media) offers extension opportunities. Getting users to update data on a device they use exponentially more frequently, can turn the usage tide (or make it more difficult to ignore/de-prioritize).
-
Summer may be winding down, but we are not!
Hello Qlik Community! Summer is winding down here in the States (though the hot, muggy weather will persist in the south until October). It always goe... Show MoreHello Qlik Community!
Summer is winding down here in the States (though the hot, muggy weather will persist in the south until October). It always goes by so quick, doesn’t it?
We have some more enhancements to share for the month of August. Here they are:
Qlik Community Video on Homepage
If you were at Qlik Connect this past June, you may have caught a glimpse of this video playing behind our booth! While on the homepage, the video will play and if you scroll down, the video will follow. You can collapse the video by clicking the button and the action will persist the next time you visit the homepage.
Subscribe to Products
If you’re on the Official Support Articles or Release Notes pages, you can now subscribe to Products! Get notified when there is a new article or release note available!
Women Who Qlik Badge
Women Who Qlik is a space to celebrate women leveraging Qlik to drive impactful outcomes, support women in data-driven roles, and amplify ally voices. Are you a member of the Women Who Qlik group? If not, join and receive the new badge!
Privacy & Cookie Notice
We’ve added the policy directly to the footer for convenience.
Do Not Share My Info
Manage your consent preferences for Cookies.
Let us know what you think of the latest changes using the comments below. The next official sprint is in October so stay tuned!
Your Qlik Community Admins,
Melissa, Sue, Jamie, Nicole, and Caleb
@Melissa_Potvin @Sue_Macaluso @Jamie_Gregory @nicole_ulloa @calebjlee
-
Entitlement Analyzer for Qlik Sense Enterprise SaaS (Cloud only)
We are happy to share with you the new Entitlement Analyzer for Qlik Sense Enterprise SaaS! This application will enable you to answer questions like:... Show MoreWe are happy to share with you the new Entitlement Analyzer for Qlik Sense Enterprise SaaS! This application will enable you to answer questions like:
- How can I track the usage of my Tenant over time? How are my entitled users using the Tenant?
- How can I better understand the usage of Analyzer Capacity vs. Analyzer & Professional Entitlements?
The Entitlement Analyzer is only available for Qlik Cloud subscription types. Refer to the compatibility matrix within the Qlik Cloud Monitoring Apps repository for an overview of which monitoring app is compatible with which subscription type.
The Entitlement Analyzer app provides insights on:
- Entitlement usage overview across the Tenant
- Analyzer Capacity – Detailed usage data and a predication if you have enough
- How users are using the system and if they have the right Entitlement assigned to them
- Which Apps are used the most by using the NEW "App consumption overview" sheet
- And much more!
The Entitlement Analyzer uses a new API Endpoint to fetch all the required data and will store the history in QVD files to enable even better Analytics over time.
A few things to note:
- This app is provided as-is and is not supported by Qlik Support.
- It is recommended to always use the latest app.
- Information is not collected by Qlik when using this app.
The app as well as the configuration guide are available via GitHub, linked below.
- QVF: https://github.com/qlik-oss/qlik-cloud-entitlement-analyzer/releases/latest/download/entitlement-analyzer.qvf
- Release Notes: https://github.com/qlik-oss/qlik-cloud-entitlement-analyzer/releases/latest
- Installation Guide: https://github.com/qlik-oss/qlik-cloud-monitoring-apps/releases/latest/download/qlik-cloud-monitorin...
Any issues, questions, and enhancement requests should be opened on the Issues page within the app’s GitHub repository.
Be sure to subscribe to the Qlik Support Updates Blog by clicking the green Subscribe button to stay up to date with the latest Qlik Support announcements. Please give this post a like if you found it helpful!
Kind regards,
Qlik Platform Architects
Additional Resources:
Our other monitoring apps for Qlik Cloud can be found below.
- App Analyzer
- Reload Analyzer
- Access Evaluator
- OEM Dashboard (for OEM Partners and multi-cloud tenants)
-
Check Out Qlik Cloud's New Look!
The revamped Qlik Cloud experience includes an enhanced left side navigation menu, new activity center, sheet grouping, and custom navigation. This ne... Show MoreThe revamped Qlik Cloud experience includes an enhanced left side navigation menu, new activity center, sheet grouping, and custom navigation.
This new platform navigation is available to those with Qlik Cloud; however, system administrators will need to turn on the feature in their Management Console Settings:
- Under Management Console, select Settings
- Scroll Down to the Feature Control Setting
- Select the Toggle for New Platform Navigation
- A message will appear prompting Admins to reload for the updated experience.
Note: These navigation updates can be toggled on or off for the remainder of the summer to give your organization time and practice with the new design. Come September, this will become Qlik’s default setting.
With the toggle on, you can now leverage the left side waffle menu as your guide, so key product features are always easily accessible.
Additionally, users can see improved sheet navigation capabilities in their analytics apps alongside other assets like bookmarks and notes.
Check out more highlights from this launch here:
Happy exploring!
Qlik Global Support
-
Creating a write back solution with Qlik Cloud is now possible!
Static, read-only dashboards are a thing of the past compared to what's possible now in Qlik Cloud. ‘Write back’ solutions offer the ability to input... Show MoreStatic, read-only dashboards are a thing of the past compared to what's possible now in Qlik Cloud.
‘Write back’ solutions offer the ability to input data or update dimensions in source systems, such as databases or CRMs, all while staying within a Qlik Sense app.
The solution incorporates both Qlik Cloud and Application Automation to enable users to input data from a dashboard or application and run the appropriate data refresh across the source system as well as the analytics.
Example Use Cases:
- Ticket/ Incident Creation
- Create Ticket or Incident in JIRA or ServiceNow.
- Data Changes
- Update Deals/Accounts in a CRM like HubSpot or Salesforce.
- Data Annotations
- Add a comment to or more records in a source system.
This new feature is possible with all of the connectors located in Application Automation, including:
- CRMs like HubSpot or Salesforce
- Databases like Snowflake, Databricks, Google Bigquery
- SharePoint
- and more!
Below you can see technical diagram based around using Application Automation for a write back solution.
The ability to write back in Qlik Cloud is a game changer for customers who want to operationalize their existing Qlik Sense applications to enhance decision making right inside an app where the analytics live. This not only streamlines business processes across an ever-growing data landscape, but it also enables users to to act in the moment. With Application Automation powering the write back executions, customers can unlock more value across their data and analytics environment.
To learn more for a more ‘hands-on tutorial’ please see video here.
- Ticket/ Incident Creation
-
Developer menu in Qlik Sense client
Did you know there's a secret developer menu in Qlik Sense? I'm going to let you in on the secret and show you how to access it and what it contains. ... Show MoreDid you know there's a secret developer menu in Qlik Sense? I'm going to let you in on the secret and show you how to access it and what it contains. Just remember, this isn't documented or officially supported, and is subject to change in the future.
To access the developer menu, follow the steps below:
- Open a sheet in a Qlik Sense app in your browser
- Add /options/developer to the url
- Right click on an object and choose "Developer"
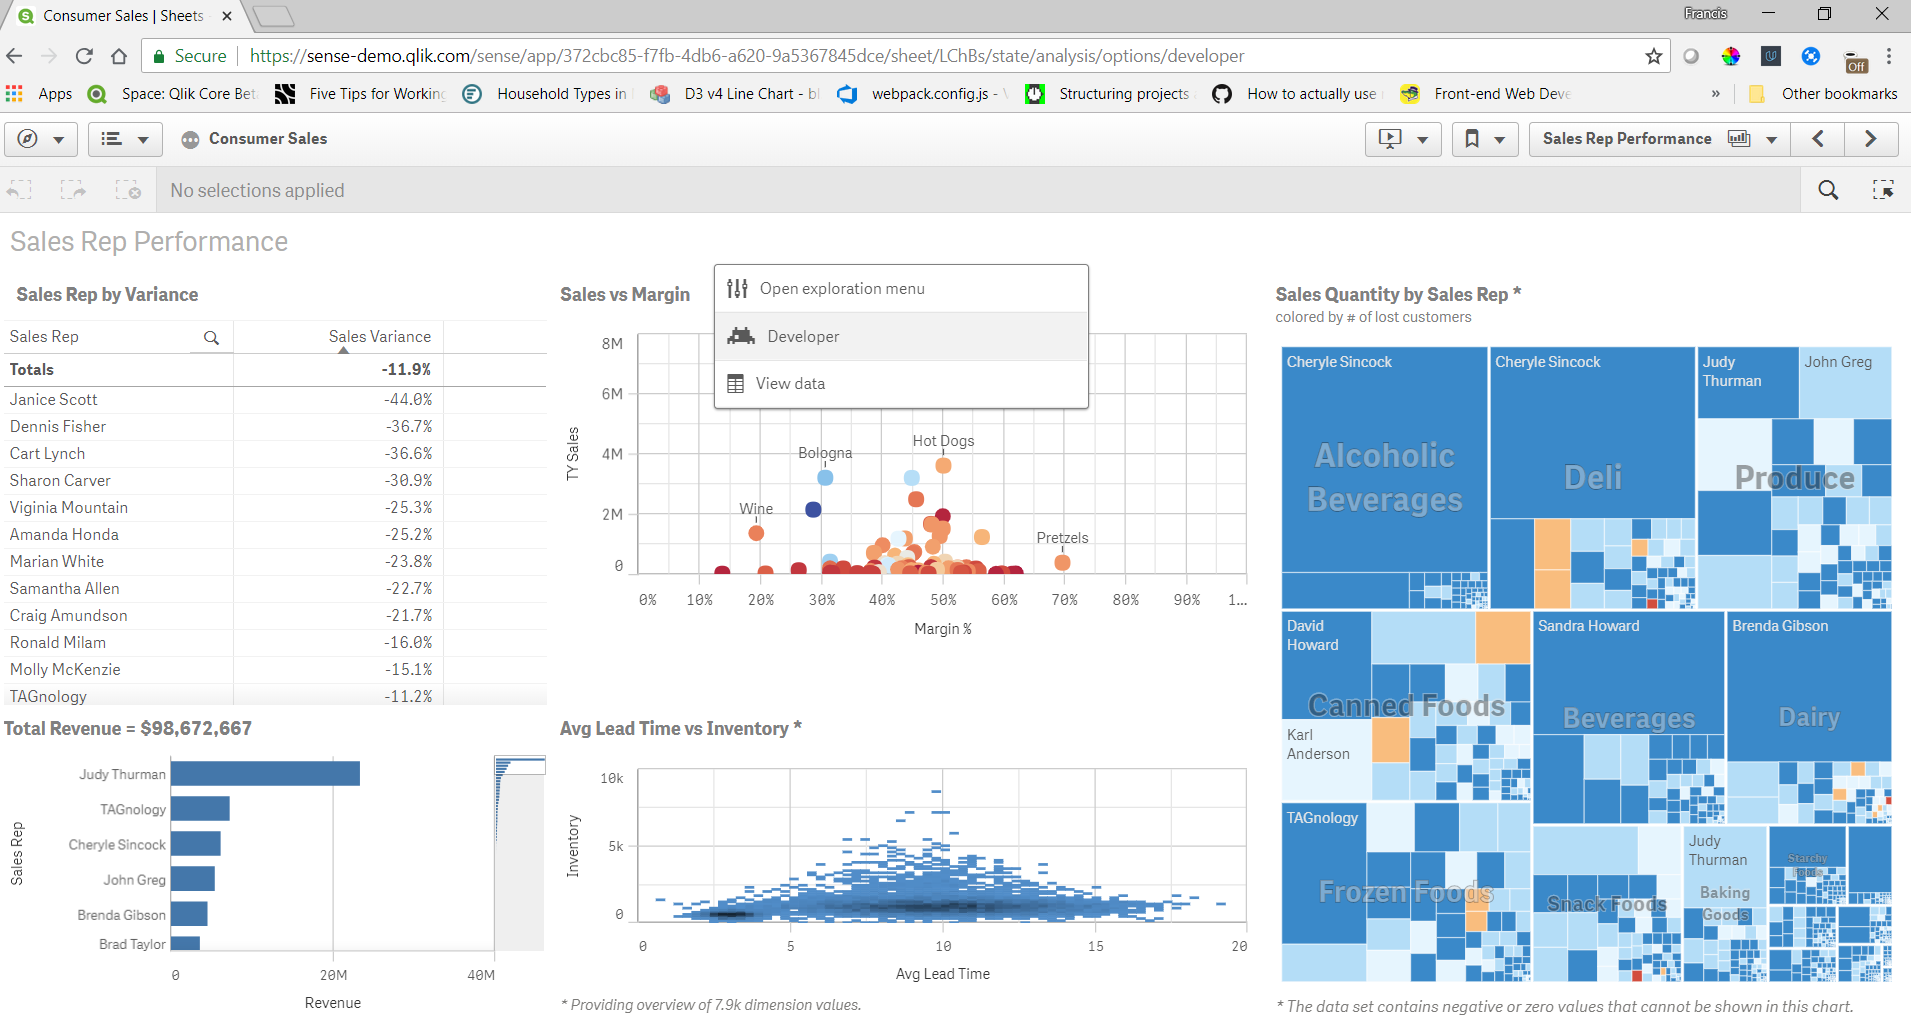
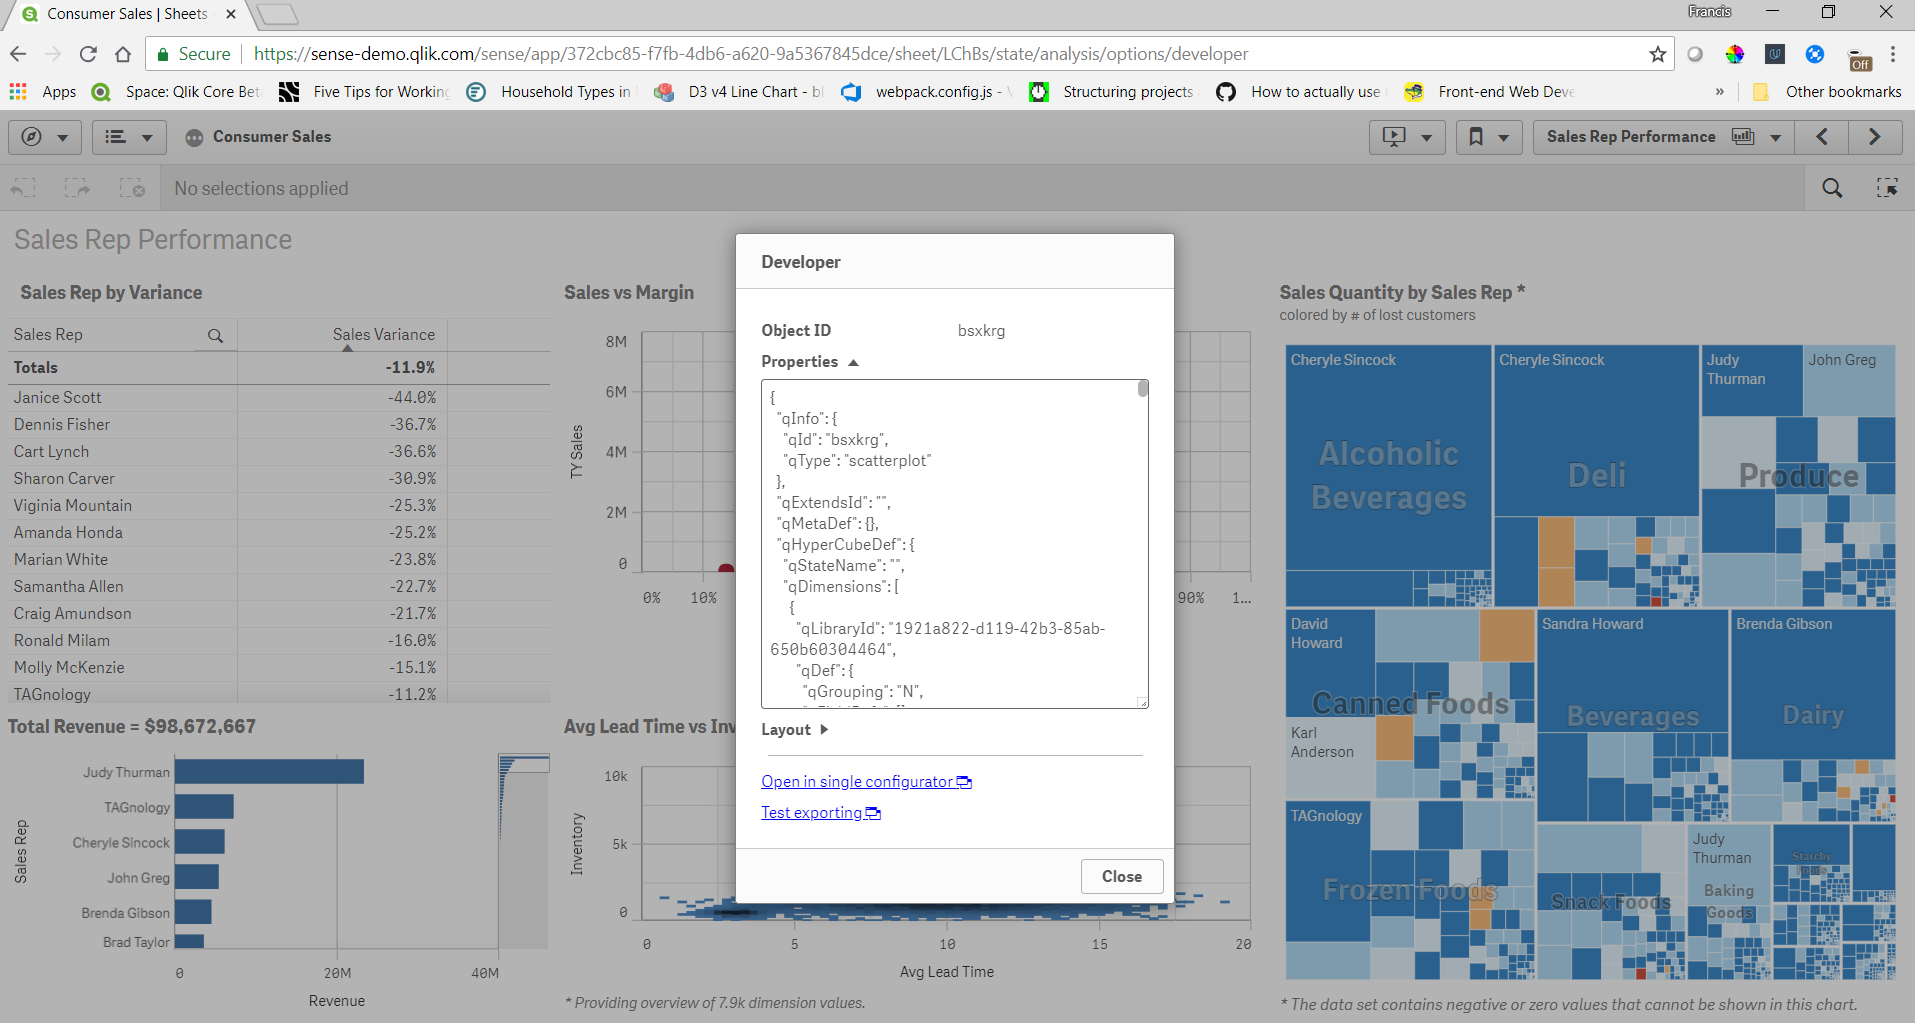
You can get the object id, properties, and layout of any object this way. There's also a link to open the object in single configurator, and test exporting. The object id's are useful for embedding visualizations. The properties are useful if you are creating your own objects and want to check the properties of an object in a Qlik Sense app for reference. In my opinion this is the most useful feature of the developer menu. Sometimes if I don't know the correct properties to set to achieve what I want I'll create a similar object in the Qlik Sense client just to check the properties. The layout shows what is returned by the engine for the layout of the object, and can be useful to see what the layout will look like before you actually create an object yourself. And the single configurator link is a handy way to get to the single configurator of an object directly from a sheet.
And now you know about the secret developer menu.
-
Air Quality Monitor App
Air Quality Monitor AppSchneider ElectricThis app was created as a submission to the May 2024 Qlik Nation Dashboard Challenge, where it was named the ... Show MoreAir Quality Monitor AppSchneider ElectricThis app was created as a submission to the May 2024 Qlik Nation Dashboard Challenge, where it was named the winner. It maps various sources of air pollution globally and compares city-level air pollution data to regional averages. The app also examines the relationship between different air pollutant concentrations and asthma rates, utilizing historical data from the World Health Organization (WHO) as the primary data source.Discoveries
Users can explore historical air pollution levels in major cities worldwide, comparing them to regional averages. The app reveals trends in air quality over time and helps identify cities with the highest and lowest pollution levels. By analyzing the concentration of specific air pollutants, such as PM2.5 and NOx, users can discover correlations between air quality and asthma rates in different regions. This app also provides insights into the impact of urbanization and industrialization on air quality, allowing users to understand the potential health risks associated with varying pollution levels. Additionally, it highlights the progress made in reducing air pollution in certain areas, offering a comprehensive view of global air quality trends.
Impact
The app has significantly impacted public health awareness by providing easy access to critical data on air pollution and its effects on respiratory health. It has enabled health professionals, policymakers, and the general public to make informed decisions about air quality management and mitigation strategies, ultimately contributing to efforts in reducing pollution-related health risks.
Audience
The audience for this app includes: 1. Public Health Professionals: Researchers and healthcare providers interested in studying the effects of air pollution on health, particularly respiratory conditions like asthma. 2. Policymakers and Government Agencies: Officials who develop regulations and policies to improve air quality and public health. 3. Environmental Organizations: Groups focused on environmental protection and advocacy, using the app to support initiatives for cleaner air. 4. Urban Planners and City Officials: Professionals involved in urban development who need data on pollution levels to make informed decisions about infrastructure and zoning. 5. Educational Institutions and Researchers: Students and academics studying environmental science, public health, or urban planning. 6. General Public: Individuals concerned about air quality and its impact on health, looking for information about pollution levels in their cities or regions.
Data and advanced analytics
The app leverages comprehensive data analytics to visualize and compare air pollution levels across different regions and times. By utilizing advanced analytics, it provides actionable insights into pollution trends and their correlation with health outcomes, enabling more targeted and effective public health interventions.
-
Qlik Cloud Wordpress plugin
Happy Friday everyone. If you have a Wordpress website and you want to incorporate visualizations from our Qlik Cloud, then you are at the right place... Show MoreHappy Friday everyone. If you have a Wordpress website and you want to incorporate visualizations from our Qlik Cloud, then you are at the right place. Below are the steps needed to install, configure and use the plugin by iframing an entire app sheet or creating a page with nebula.js and pulling just by ids.
Installation into WordPress
- Login to your WordPress Admin Portal.
- On the left navigation panel, select "Plugins".
- Towards the top of the plugins list, click the "Add New" button.
- In the search box towards the right-hand side, type "Qlik" and hit enter to search.
- The Qlik Saas plugin is currently one of only two results returned. Click the "Install Now" button next to it.
- WordPress will then download and install the plugin for you. Once complete, "Install Now" button will change to "Activate". Click the "Activate" button to complete the installation.
Configure Qlik Cloud
- Create a public / private key pair for signing JWTs
- Configure JWT identity provider
- Add the public key to the configuration
- Input Issuer & Key ID
https://qlik.dev/tutorials/create-signed-tokens-for-jwt-authorization#input-issuer-and-key-id-values
Configure plugin
- Add Host of Qlik Saas as <tenant>.<region>.qlikcloud.com
- Add your WebIntegrationID
https://qlik.dev/tutorials/implement-jwt-authorization#configure-a-web-integration-id
- Add you AppID
- Add your Private key from previous step “Create a public / private key pair for signing JWTs”
- Add the Key ID created from previous step
https://qlik.dev/tutorials/create-signed-tokens-for-jwt-authorization#input-issuer-and-key-id-values
Using the plugin
- iFrame an entire sheet by adding the shortcode into your page
[qlik-saas-single-sheet id="1ff88551-9c4d-41e0-b790-37f4c11d3df8" height="400" width="500"]- Add object by adding the object id or "selections" for the current selections toolbar, with a shortcode into your page
[qlik_saas_object id="selections" height="50"][qlik_saas_object id="CSxZqS" height="400"]iFrame sheet shortcodeiFrame sheet previewMashup shortcodesMashup Helpdesk sheet 1 and 2 with nebula.js and object IDsSheet 2That's it!/Yianni -
Unlock Qlik Answers
Qlik has launched a plug-and-play Generative AI-powered Retrieval Augmented Generation (RAG) solution, Qlik Answers. Here, organizations can tap into ... Show MoreQlik has launched a plug-and-play Generative AI-powered Retrieval Augmented Generation (RAG) solution, Qlik Answers. Here, organizations can tap into their unstructured sources like document repositories, knowledge libraries, or even operational systems. You’ll be able to leverage trusted enterprise connectors to connect to a broad range of systems and platform out of the box, ask questions directly to the prebuilt UI, and have access to trusted content which will empower your users to substantiate answers.
Watch our quick demo below to see how you can bring knowledge to your fingerprints from your unstructured data with just a simple question.
Add Qlik Answers to your solution set by contacting us.
For those who have already made the move, you’ll be able to create Qlik Answer cases in your Customer Portal starting Thursday, August 8, 2024. If you need any troubleshooting assistance prior, please don’t hesitate to contact us through our live chat.
Thanks for choosing Qlik!
Qlik Global Support
-
Qlik Cloud 7月の新機能
Qlik Answers のリリース Qlik Answers はパーソナライズされた、コンテキストに関連した回答をビジネスユーザーに提供するプラグアンドプレイの生成AIを搭載したナレッジアシスタントです。 ※現時点では、US、EU、Sydney リージョンで利用できます。 Introducing ... Show MoreQlik Answers のリリース
Qlik Answers はパーソナライズされた、コンテキストに関連した回答をビジネスユーザーに提供するプラグアンドプレイの生成AIを搭載したナレッジアシスタントです。
※現時点では、US、EU、Sydney リージョンで利用できます。
Qlik Answers では大規模言語モデルを使ったプラグアンドプレイのアシスタントにより、非構造化データを素早く活用することができます。ナレッジベースにテキストやPDFなどのデータを蓄積し、回答するためのインデックスをつけます。
アシスタントでは自然言語により回答を得ることができ、回答のもととなったソースを参照することもできます。
分析の新機能
Visualization bundle の新しいストレート テーブルの修飾子と数式ベースのテキスト スタイル
- 修飾子が使えるようになりました。 累計、移動平均、差分、相対数から選べます。
- テキストスタイル式で書式を設定できるようになりました。
<B>: 太字、<I>: 斜体、<U>: 下線、<S>: 取り消し線
if(sum(案件金額)>3000000000,‘<B>’)のように条件付けも可能
表形式レポート関連機能の改善
- スペースとアプリへの再接続の操作改善
Microsoft Excel の Qlik アドインで、テンプレートをアプリのコピーまたは別のスペースやテナントのアプリに再接続する必要があるときに、選択リストから目的のスペースとアプリケーションを簡単に選択できるようになりました。
- PDFの日付と数値書式への地域設定改善
レポートタスク開発者は、PDF形式レポートについて地域の書式設定を指定できるようになりました。
PDF形式で作成されるオンデマンドの表形式レポートでは、ユーザーのQlik Cloud のロケールがレポート内の日付と数値のフォーマットを決定します。
Microsoft Excel用のQlikアドインからPDF形式でプレビューを生成する場合、ユーザーのMicrosoft Excelロケールがレポート内の日付と数値のフォーマットを決定します。
Qlik データゲートウェイー直接アクセス 新バージョン
- プロセス分離の作業時におけるポート割り当てのサポート
以前は、既定のポート番号と範囲設定を使用する場合、[ODBC|SAPBW|SAPSQL]_MAX_PROCESS_COUNT 値を 10 より大きく設定することはできませんでした。このバージョンから、ポートは自動的に割り当てられるようになり、同時リロード プロセスの数を 10 より大きく設定できるようになりました。
- SQP SQL (Direct Access gateway 経由) コネクタを使用する場合のメタデータ ページングの強化
10,000 個以上のテーブルが取得される場合、タイムアウトを防ぐために、テーブルは 10,000 個のバッチで取得されます。
- データ チャンク回復メカニズム
欠落または破損したデータチャンクの送信のサポートが導入されました。リロードされたデータチャンクのメモリサイズを制御するために、configuration.properties ファイルに新しいプロパティが追加されました: RELOAD_CACHE_MEMORY_MB
このプロパティの設定方法については、「Storing corrupted or missing data chunks for future reloads」 (破損または欠落したデータチャンクを将来のリロードのために保存する)を参照してください。
データ統合の新機能
データ製品カタログ
データマーケットプレイスで信頼できるデータを選択・利用することができます。
- データ製品マネージャーがデータ製品を作成し、データセットを追加します。Read meや連絡先の付加も可能です。
- データ品質スコアの算出と、セマンティック タイプの検出機能があります。現時点では Snowflake データセットでのみ使用できます。
- データセットについて系列と影響分析をみることができます。
- データセットを選択して、分析アプリを作ることができます。
-
Qlik Talend Cloud の Enterprise エディションが必要です。
SaaS アプリケーション コネクタの強化
- ゲートウェイレスデータローダー機能
ゲートウェイやドライバーをインストールする必要のない、新しいデータ ローダー機能が導入されました。SaaS ベースのクラウド ソースと一部のデータベース ソース向けに設計されています。Qlik Talend Cloud のStarter エディション以上でご利用いただけます。
- 多数のSaaS アプリケーション コネクタ
新しいデータ ロード機能のリリースに合わせて、Qlik Talend Cloud が接続できる SaaS アプリケーションの数が大幅に増加しました。 100 以上のアプリケーションのデータに、アクセスすることができます。サポート対象のすべてのアプリケーションを確認するには、Supported SaaS applications をご参照ください。
新しい Qlik Talend データ統合のランディング ページ
Qlik Talend データ統合のランディングページには、有効に活用するための重要なアクションが強調表示されます。最近更新された項目や通知に関するコンポーネントも追加されており、作業中のコンテンツにすばやくアクセスでき、重要な更新を見逃すことがなくなります。
メタデータの更新
データセットがソースオブジェクトに基づいている場合に、データセットのメタデータを手動でリフレッシュする機能を提供します。これにより、新しい列や削除された列、データ型の変更など既存の列の変更、列名の変更が検出されます。タスクのメタデータは、タスクの [デザイン] ビューでソースのメタデータの変更に合わせてリフレッシュできます。タスク内のすべてのデータセットのメタデータを更新したり、個別のデータセットを選んで更新することができます。
SQL Expression プロセッサ
SQL Expressionプロセッサが、データ統合のデータ変換フローの一部として利用できるようになりました。SQL Expressionプロセッサを使用すると、データ変換フローの中で、カスタムのSQL式を記述できます。SQL Expression processor
Microsoft SQL Server での変換フローのサポート
Microsoft SQL Serverをターゲットとして使用するデータパイプラインプロジェクトで、変換フローがサポートされるようになりました。ユーザーは、カスタムSQLベースの変換と一緒にグラフィカルな変換を開発し、データを再構築するための複雑な要件をサポートできるようになりました。

-
Exploring the Latest Developments in Qlik Embedding
In previous blog posts (1, 2, 3) , we explored different topics around Qlik's embedding library, qlik-embed, and how to integrate it seamlessly with O... Show MoreIn previous blog posts (1, 2, 3) , we explored different topics around Qlik's embedding library, qlik-embed, and how to integrate it seamlessly with OAuth for authentication. Today, we'll delve into the latest updates and new features, including embedding Qlik Answers, go over UI capabilities, and advanced configuration options.
Recap: What is qlik-embed?
qlik-embed is a versatile library designed to facilitate the embedding of Qlik Sense analytics into web applications. By using web components, it allows developers to easily integrate Qlik's powerful analytics capabilities without dealing with the complexities of traditional embedding methods. The library supports various authentication methods, including Qlik Cloud API keys, OAuth2 clients, and Qlik Sense Enterprise interactive login.
In our previous discussions, we highlighted the ease of use and the flexibility qlik-embed offers, supporting components such as chart, field, selections, and entire app.
New Feature: Embedding Qlik Answers
One of the most exciting additions to qlik-embed is the ability to embed Qlik Answers. Qlik Answers leverages AI to provide natural language querying capabilities, allowing users to interact with their data using conversational language (If you haven’t already checked that out, visit this Community post or watch this demo video). The new UI component ai/assistant enables this functionality directly right within your web app.
Here's an example of how you can integrate Qlik Answers into your application:
<qlik-embed
  ui="ai/assistant"
  assistant-id="<assistant-id>"
  appearance="qlik-light"> // or "qlik-dark"
</qlik-embed>
This simple integration can greatly enhance user interaction by allowing them to ask questions and receive insights in real-time, making data exploration more intuitive and user-friendly.
More on UIs and Parameters
As I mentioned before, the qlik-embed framework supports a variety of UIs, each designed for specific purposes. Let’s take a quick overview on each one:
- analytics/sheet: For embedding entire Qlik Sense sheets with full selectivity but without additional features like alerts or notes. (Supports sheets that contain only nebula.js visualizations, for a full list: see here: https://qlik.dev/embed/foundational-knowledge/visualizations/)
<qlik-embed id="visualization" ui="analytics/sheet" app-id="13b05004-2752-4f39-a077-7a71c5816997" object-id="bdGHw"></qlik-embed> - analytics/chart: For embedding single chart objects or creating charts on the fly with better performance. (Supports nebula.js objects only, see full list above)
<qlik-embed id="visualization" ui="analytics/chart" app-id="13b05004-2752-4f39-a077-7a71c5816997" object-id="hshG"></qlik-embed> - analytics/field: A lightweight listbox for a specific field (dimension or measure)
(To find the library-id, you can add /options/developer to the URL when editing a sheet, right click on a object containing your master dimension or measure then click on Developer and look for the qLibraryId value)<qlik-embed id="visualization" ui="analytics/field" app-id="13b05004-2752-4f39-a077-7a71c5816997" library-id="BfXheUu" type="dimension"></qlik-embed> - analytics/selections: Displays a selection bar with controls for managing selections.
<qlik-embed id="visualization" ui="analytics/selections" app-id="13b05004-2752-4f39-a077-7a71c5816997"></qlik-embed> - classic/app: Provides a full-featured Qlik Sense sheet analysis and authoring experience.
<qlik-embed id="visualization" ui="classic/app" app-id="13b05004-2752-4f39-a077-7a71c5816997"></qlik-embed> - classic/chart: Backwards-compatible for single chart objects (legacy), including support for extensions.
<qlik-embed id="visualization" ui="classic/chart" app-id="13b05004-2752-4f39-a077-7a71c5816997" object-id="hshG" iframe="true"></qlik-embed>
Each UI type can be configured with various parameters to customize the appearance and functionality. For example, you can set the theme, dimensions, measures, and even complex properties for charts.
Here’s an example of embedding a dynamic chart (See here for more info about Charts on the Fly)
<qlik-embed
  ui="analytics/chart"
  app-id="YOUR_APP_ID"
  type="barchart"
  dimensions='["Category"]'
  measures='["Sum(Sales)"]'
  properties='{"orientation": "horizontal"}'>
</qlik-embed>
This flexibility allows you to create highly dynamic and interactive dashboards that can adapt to users' needs in real-time.
Advanced Configuration: Context Parameters and Themes
A cool feature of qlik-embed is the ability to pass context parameters using the context__json attribute. This allows for more granular control over the embedded visualizations, enabling customization of themes, interactions, and other properties directly within the web component.
Reference my previous post about this here.
Accessing the App Model through qlik-embed
With qlik-embed, you can access the metadata of a Qlik Sense application, including, but not limited to, obtaining a list of sheets and adding them to a dropdown list element for instance.
Keep in mind that this won't work with the classic/app UI
<!DOCTYPE html>
<html lang="en">

<head>
    <meta charset="UTF-8" />
    <meta name="viewport" content="width=device-width, initial-scale=1.0" />
    <meta http-equiv="X-UA-Compatible" content="ie=edge" />
    <style>
        body,
        html {
            margin: 0;
            padding: 0;
            font-family: sans-serif;
            font-size: 14px;
            background-color: #f5f5f5;
            color: #333;
            height: 100%;
            width: 100%;
        }

        .container {
            padding: 8px;
            gap: 8px;
            position: relative;
            flex: 1 0 auto;
            display: flex;
            flex-direction: column;
            align-items: stretch;
            box-sizing: border-box;
        }

        .classic-app {
            height: 800px;
            width: 1200px;
            border: 1px solid #bbb;
            flex-grow: 1;
            border-radius: 3px;
            box-shadow: 1px 1px 10px rgba(0, 0, 0, 0.2);
            position: relative;
            box-sizing: border-box;
            overflow: auto;
            position: relative;
        }

        .viz {
            width: 1200px;
            height: 900px;
            padding: 16px;
            border: 1px solid #bbb;
            border-radius: 3px;
            box-shadow: 1px 1px 10px rgba(0, 0, 0, 0.2);
            position: relative;
        }
    </style>
    <title>@qlik/embed-web-components example - using OAuth</title>
    <script crossorigin="anonymous" type="application/javascript"
        src="https://cdn.jsdelivr.net/npm/@qlik/embed-web-components"
        data-host="https://YOUR_TENANT.us.qlikcloud.com" data-client-id="CLIENT_ID"
        data-redirect-uri="https://localhost:3000/index_oauth_object.html" data-access-token-storage="session"></script>

    <script type="module">
        const embeddedObject = document.getElementById("visualization");
        const refApi = await embeddedObject.getRefApi();
        console.log('refApi -> ', refApi);
        const doc = await refApi.getDoc();
        const appSheetList = await doc.getSheetList();

        //add the sheet references to a dropdown list
        let dd = document.getElementById('sheetdrop');
        dd.length = 0;
        let defaultOption = document.createElement('option');
        defaultOption.text = "Select a sheet to navigate to";
        dd.add(defaultOption);
        dd.selectedIndex = 0;

        let option;
        for (let i = 0; i < appSheetList.length; i++) {
            option = document.createElement('option');
            option.text = appSheetList[i].qMeta.title;
            option.value = appSheetList[i].qMeta.id;
            dd.add(option);
        }

        //add a listener to change the object-id property in the qlik-embed element
        dd.addEventListener("change", function () {
            if (dd.selectedIndex > 0) {
                let selOption = dd.options[dd.selectedIndex];
                console.log(selOption.value);
                embeddedObject.setAttribute('object-id', selOption.value);
            }
        });
    </script>
</head>

<body>

    <div id="main-app">
        <div class="container">
            <h1>@qlik/embed-web-components Example</h1>
        </div>

        <div>
            <select id="sheetdrop" name="SheetList">
            </select>
        </div>

        <div id="analytics-chart" class="container">
            <div class="viz">
                <qlik-embed id="visualization" ui="analytics/sheet" app-id="27018b4a-eaa7-4658-a8c2-ecf48d321371"
                    object-id="d568340d-1264-473e-bbdf-68d2555f007e"></qlik-embed>
            </div>
        </div>
</body>

</html>
The continuous evolution of qlik-embed brings exciting new features that enhance the integration of Qlik analytics into web applications. Stay tuned for more updates and explore the full potential of qlik-embed on qlik.dev. - analytics/sheet: For embedding entire Qlik Sense sheets with full selectivity but without additional features like alerts or notes. (Supports sheets that contain only nebula.js visualizations, for a full list: see here: https://qlik.dev/embed/foundational-knowledge/visualizations/)
-
Summer fun means Qlik Community enhancements!
Hello Qlik Community! Summer has officially kicked off here in the States! Does anyone have any exciting summer plans? My plan is to enjoy the local p... Show MoreHello Qlik Community!
Summer has officially kicked off here in the States! Does anyone have any exciting summer plans? My plan is to enjoy the local pool, travel on vacay to another pool, then come back to enjoy the local pool some more. 😄 Oh, and during that time, we will still be pushing out updates and enhancements!
Here are the enhancements for June:
Product Labels added to Release Notes page
Find all the posts related to Products on the Release Notes page!
Receive Notifications to Release Note Updates
A new setting has been implemented that allows users to be notified of updates to Release Notes.
Simplified breadcrumbs under Support
Now only shows the page your own and the Qlik Community homepage to lessen any confusion. Look for more cleanup in other areas throughout the year.
More updates to Email Notifications
We’ve been working on making the email notifications more organized and follow Qlik branding. We’ve removed the banner at the top of the email as it was having trouble with resizing and updated the @mention template.
Check back in a few weeks for our July enhancements as well as our contest winners!
Your Qlik Community Admins,
Melissa, Sue, Jamie, Nicole and Caleb
@Melissa_Potvin @Sue_Macaluso @nicole_ulloa @calebjlee
-
Qlik Sense SAML – A standardized approach to authentication
Hello everyone, today I have the pleasure of introducing Jeff Goldberg as our guest blogger - (jog) - Jeff is a Senior Enterprise Architect on the Am... Show More
Hello everyone, today I have the pleasure of introducing Jeff Goldberg as our guest blogger - (jog) - Jeff is a Senior Enterprise Architect on the Americas Pre-sales team who has worked in various technology positions for over 15 years. In between running half-marathons and crushing crossfit workouts , Jeff focuses on integration, deployment, automation, security, and api topics across a wide range of software. If you have a technical challenge, Jeff can put you on a path to figuring out the best way to overcome it. Jeff has the extreme pleasure of introducing you to SAML authentication with Qlik Sense, not only in text - but as well in supporting videos. Thanks for this valuable contribution Jeff!
Qlik Sense SAML
With the release of Qlik Sense 2.0, we introduced SAML as an authentication option between enterprise identity management systems (known as identity providers) and Qlik Sense. While SAML is a standard for authentication and authorization, it is open to interpretation and variability in its implementation. Consequently, implementing SAML can be a bit tricky. The goal of this blog post is to demystify SAML and provide some examples you can use to implement it with Qlik Sense.
SAML stands for Security Assertion Markup Language, an xml based authentication and authorization standard for web applications to exchange user credentials and attributes. SAML works between two parties, an identity provider (IdP) and a service provider (SP), to facilitate single sign-on access to secure content for a user.
Identity providers come in a variety of shapes and sizes. Salesforce.com, Active Directory Federation Services, and Ping Federate are just a few of the options available for handling the authentication components of the SAML handshake. The service provider is the system with the content we want to access. In this case, Qlik Sense is the service provider.
The figure below illustrates the SAML authentication process.
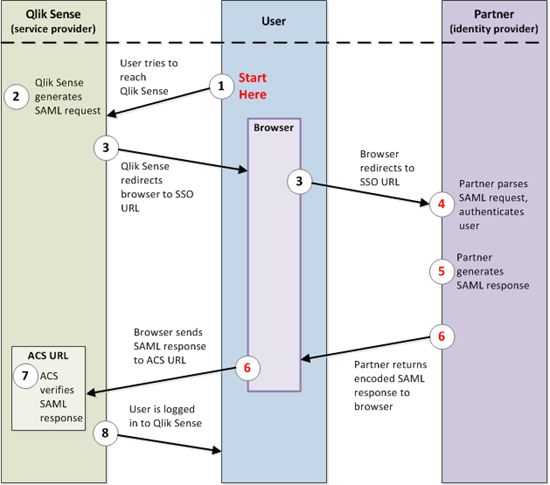
Keep in mind the SAML protocol is an open standard, therefore, implementing the solution between the SP and the IdP differs based on the requirements of the chosen provider.
For example:
- ADFS metadata contains a whole section of information that needs to be removed before it is imported into Qlik Sense.
- With Ping Federate, the IdP configuration needs to have the name ID format for the SAML response manually set to transient or the user authentication to Qlik Sense will fail.
- One login doesn’t care about the name ID format for the response.
Bottom line, expect some trial and error when configuring SAML, regardless if it’s with Qlik Sense or some other solution.
To ease the pain and hopefully reduce frustration, we have created some videos to help walk through configuring different SAML identity providers with Qlik Sense. As we encounter more flavors of IdP, we will create content to help with configuration.
For now, have a watch of the following videos, enjoy!
-
【10/10(木)15:00 開催】25 年の Excel 体制から脱却なるか!?BI ツール導入奮闘記
企業のビジネス活動において、データはこれまで以上に必要不可欠な資産となっています。増え続けるデータを管理・統合・分析し、データでアクションを起こす必要性が増している現在、成功している企業はどのようなデータ戦略を実行しているのか?本 Web セミナーシリーズでは、Qlik でデータからアクションを起こ... Show More企業のビジネス活動において、データはこれまで以上に必要不可欠な資産となっています。増え続けるデータを管理・統合・分析し、データでアクションを起こす必要性が増している現在、成功している企業はどのようなデータ戦略を実行しているのか?
本 Web セミナーシリーズでは、Qlik でデータからアクションを起こすデータ主導のビジネスで成功しているお客様より、課題から導入の経緯、デモンストレーション、活用例などをご紹介します。※ 参加費無料。パソコン・タブレット・スマートフォンで、どこからでもご参加いただけます。
【10/10(木)15:00 開催】
25 年の Excel 体制から脱却なるか!?BI ツール導入奮闘記株式会社イノベーションでは、Excel ・スプレッドシートによる分析と共有の文化が根強く、有効なデータ活用が進んでいませんでした。情報をデータベース化して Qlik Sense に取り込むことで、あらゆる指標の日次データを取得し、顧客別など細分化されたレベルの分析が可能になりました。
本講演では、最近 Qlik を導入した背景とそのプロセス、現時点で得られた成果についてご紹介します。Excel に頼っていたデータ管理からの脱却を目指し、迅速なデータモデリングと可視化を実現するために Qlik を選んだ理由とは?1 人プロジェクトで社内の反発や課題をどのように乗り越えたのか、導入半年のリアルな姿や将来展望についてお話しします。 -
Talend Login Credentials Moving to Qlik Unified Login This May
Update as of May 15, 2024: Moved the dates back by one week. As part of Qlik’s ongoing effort to unify our presence with Talend offerings, we are movi... Show MoreUpdate as of May 15, 2024: Moved the dates back by one week.
As part of Qlik’s ongoing effort to unify our presence with Talend offerings, we are moving Talend login credentials to use the same authentication mechanism as other Qlik web properties. This will improve our overall customer experience and provide Talend customers greater access to data integration, quality, and analytics capabilities.
Starting May 21, 2024, the login mechanism for Talend Cloud customers will change to use the Qlik Account authentication infrastructure. This is not a forced migration to using Qlik Cloud applications or services; no other infrastructure is changing. Existing Talend Cloud login credentials will switch to a new authentication provider.Review our most frequently asked questions below:
What is Qlik Account?
Qlik Account helps users access multiple Qlik services using one set of credentials. Once registered Qlik customers and partners can access their Qlik Cloud applications, Talend Cloud, Support Portal, and the Downloads page. Users can also access Qlik Community and Qlik Continuous Classroom (QCC). Additionally, partners can use their Qlik Account to access the Partner Portal.
When will the conversion take place?
The migration timing depends on your geographic region as follows
- May 21, 2024 – Asia Pacific, including Australia and Japan
- May 23, 2024 – Europe
- June 18, 2024 – Americas
Do I need to take any proactive action?
No, but you can create a Qlik Account before the conversion dates.
Note: You must use the email address listed in your Talend Cloud profile when creating your Qlik Account. Do not use your Login Name.
What happens during the conversion process?
The following video explains the process of moving to a Qlik Account, referred to as Qlik ID.
Can I create and use a Qlik Account before May 14th?
Yes. Follow this link for instructions on creating your Qlik Account.
Note: If you create a Qlik Account before May 14th, then you must use the same email address listed in your Talend Cloud profile (see Figure 1.) and not your Login Name.
Figure 1. Talend Cloud Profile
Figure 1a. Use your Email address, not the Login Name
What if I have multiple Talend Cloud tenants?
A web page displaying your currently active Qlik Cloud and Talend Cloud tenants will be displayed after a successful login. You can then navigate to a specific tenant by clicking on the appropriate tile (see Figure 2.)
Figure 2. Tenant Selection Page
What if I have multiple Talend Cloud tenants and one or more of them doesn't appear on the multiple tenants web page?
Synchronization to populate your tenants list can take from ten seconds to a couple of minutes. If the web page doesn't populate your tenants list, the synchronization process will run again after two hours.
Another reason why all tenants may not appear in the list is a "region" query string parameter has been added to the URL. Simply remove the region parameter and the value, refresh the page, and the full list of tenants will appear.
What if I receive the No Tenants to manage page?
If you see this page after completing the migration (see Figure 3,) the synchronization process may not have completed or you may have a mismatch between your Qlik Account email and your Talend Cloud tenant email.
Figure 3. No Tenants to Manage Page
You can fix the email mismatch by using the Talend Legacy Login link. You will be redirected to the old Talend login page. Follow these steps:
1. In your browser, navigate to https://iam.<region>.cloud.talend.com/idp/login?legacy=true where
"<region>" is the region your Talend Cloud tenant resides.2. Authenticate to your tenant with your Talend userId and password.
3. Click on your name in the right side of the Talend toolbar.
4. Select Profile preferences from the menu.
5. In the Email field, update the email address to match your Qlik Account email address.
6. Save your profile.
7. Logout of the Talend tenant and navigate to the Qlik Cloud login page at https://login.qlik.com.
8. Log into Qlik Cloud using your Qlik Account.
What if I change my email address in my Talend tenant to something different from my Qlik Account?
You will not be able to access your Talend tenant if the email address for your user profile in the tenant doesn't match your Qlik Account email address.
What if I already have a Qlik Account?
Great! No further action is required.
What if I use single sign-on (SSO) to log in?
Single sign-on functionality is not changing and you do not have to switch authentication providers. Access the updated sign-in page directly by entering https://iam.<region>.cloud.talend.com/idp/login-sso where <region> is the location of your Talend Cloud tenant. When you see this page, confirm your Talend Cloud region and enter the email you use to access Talend Cloud through your single sign-on provider.
When you press next you will be redirected to your identity provider authentication process.
Do I need to recreate any bookmarks?
No. Your existing bookmarked pages should redirect to use the new login mechanism.
What is the Qlik Account login page URL?
To access the new Qlik Cloud login page visit https://login.qlik.com
Can I keep using the legacy login instead of Qlik Cloud login?
The legacy login is available for a limited time to help users resolve email mismatches between Talend tenants and Qlik Account. Qlik reserves the right to deprecate this URL at any time with limited notice.
Who do I contact if I experience login difficulties?
If you experience login difficulties, please chat with our agents on Customer Portal or email us at customersupport@qlik.com.
-
Hot Wheels Card Game
Hot Wheels Card GameBildenThis application was built with the aim of practicing and exploring the possibilities of Layout Container in QlikSense. The ... Show MoreHot Wheels Card GameBildenThis application was built with the aim of practicing and exploring the possibilities of Layout Container in QlikSense. The card game has a similar mechanic to the game Top Trumps, where the player chooses an attribute of his card and compares it with that of his opponent. It is not an application for commercial use, although many of the resources used have applications in real analytical dashboards, such as modal pop-ups, logic control in variables and others. I tried to make the most of the new features made available in the latest updates, such as the Layout Container, border customizations, shadows and component background images.Discoveries
Flexibility and countless visualization possibilities with Layout Container and new features from Qlik
Impact
New ways to build interfaces, using knowledge of visual resources improved in this application
Audience
Mainly Qlik developers, but also any enthusiast of the tool who is interested in new possibilities
Data and advanced analytics
As the focus of this application is the visual part, there is no relevant data or insight to highlight.