Unlock a world of possibilities! Login now and discover the exclusive benefits awaiting you.
- Qlik Community
- :
- Search the Community
- :
- Problem in my pivot table
- Subscribe to RSS Feed
- Mark Topic as New
- Mark Topic as Read
- Float this Topic for Current User
- Bookmark
- Subscribe
- Mute
- Printer Friendly Page
- Mark as New
- Bookmark
- Subscribe
- Mute
- Subscribe to RSS Feed
- Permalink
- Report Inappropriate Content
Problem in my pivot table
Hello Everyone,
I have created a pivot table then I dragged and dropped the second attribute in order ro create a matrix, but it doesn't show me all my the rows in my database only if I select a filter as you can see in the screenshots. Please help me resolve this problem.
Thank you for you Help.
- Mark as New
- Bookmark
- Subscribe
- Mute
- Subscribe to RSS Feed
- Permalink
- Report Inappropriate Content
What is your pivot table measure expression?
- Mark as New
- Bookmark
- Subscribe
- Mute
- Subscribe to RSS Feed
- Permalink
- Report Inappropriate Content
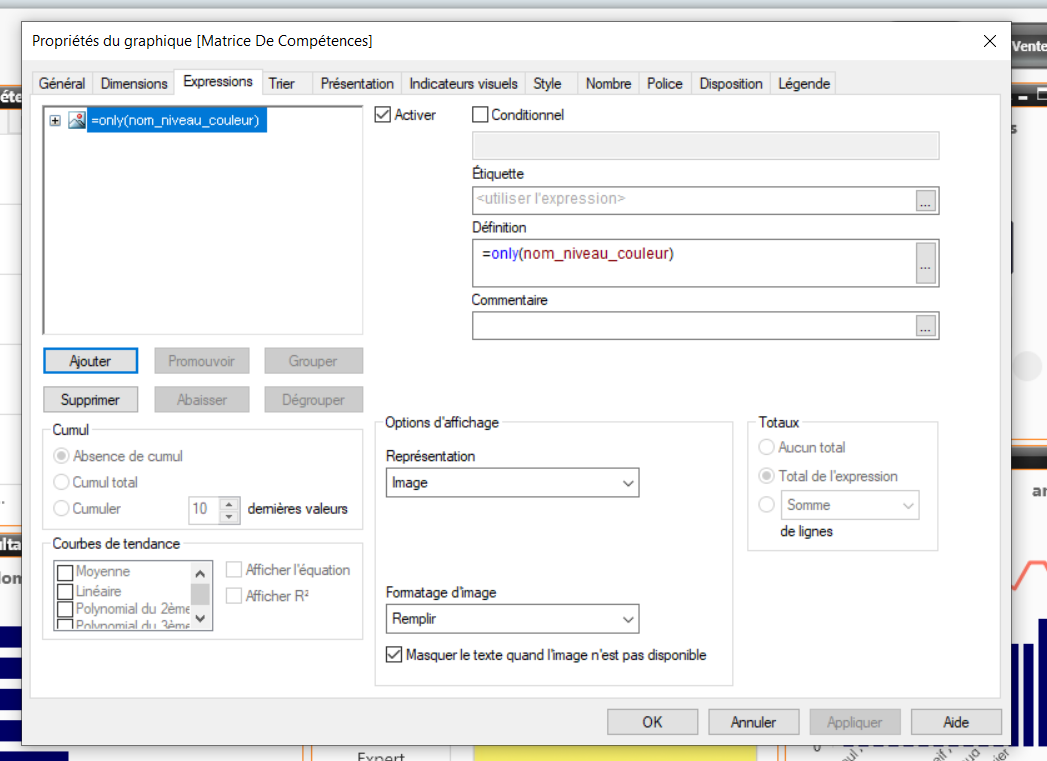
Does my problem come from this ?
- Mark as New
- Bookmark
- Subscribe
- Mute
- Subscribe to RSS Feed
- Permalink
- Report Inappropriate Content
Maybe your selection is limiting to 1 "nom_niveau_couleur" and without selection there is many values so only() function is returning null. Sorry i don't understand fully with details and language. but that's reasonable to think. What if you do count(nom_niveau_couleur) instead and show as number (or a 2nd expression). Does this equal 1 where you expect it to?
- Mark as New
- Bookmark
- Subscribe
- Mute
- Subscribe to RSS Feed
- Permalink
- Report Inappropriate Content
Yes, It worked but now it doesn't show me the colours .
- Mark as New
- Bookmark
- Subscribe
- Mute
- Subscribe to RSS Feed
- Permalink
- Report Inappropriate Content
Did you change "Representation" to text? I realized it was going to drop out the colours, I wanted to see what the count number it would return. if it's more then 1 your only function would not work.
- Mark as New
- Bookmark
- Subscribe
- Mute
- Subscribe to RSS Feed
- Permalink
- Report Inappropriate Content
Here is the result
- Mark as New
- Bookmark
- Subscribe
- Mute
- Subscribe to RSS Feed
- Permalink
- Report Inappropriate Content
So you have cells with > 1 color (seen now with your count(nom_niveau_couleur)). You'll need to determine which color should be displayed in this scenario. For example BETREMIEUX x C#. Maybe its a max date you need to limit color by, or have a numeric colour equivalent and take max colour. Or maybe your colour association doesn't match your pivot table when you thought it does.
But if you use only() and on a measure that has more then 1 value it will return null. I believe this is your issue.
- Mark as New
- Bookmark
- Subscribe
- Mute
- Subscribe to RSS Feed
- Permalink
- Report Inappropriate Content
So how can I get this right so It does show me the highest level or the highest colour ?
- Mark as New
- Bookmark
- Subscribe
- Mute
- Subscribe to RSS Feed
- Permalink
- Report Inappropriate Content
How do you want to determine "highest level". Let's say you have below where you want the colour_value used to determine which color to take (highest colour_value) in case of a tie
load * inline [
colour, colour_value
red, 10
blue, 9
green, 8
]
;
Try this calculation:
firstsortedvalue([colour], aggr(max(colour_value), [Nom_Complet], [Com_Technologie]))
-
Qlik Community
-
Forums
- Data Integration & Quality
- Analytics
- AI/ML
- Forums by Product
-
Groups
- Industry and Topics
- Location and Language
- Leader
- Support
- Blogs & Events
- Discover
- Community Sitemap
- All Forums
- Subprocessors List
-
Forums